APE BARRHave you been accumulating APE within the last half year? If you did so, good job.
I am not a big fan of NFTs and APE but if you can make money out of this shitcoin, I'll gladly take my chances. We've a pretty clean BARR bottom with 3 critical levels on the 3D/Weekly chart.
TA: APE broke out of the double bottom nicely, most important level is around 3.33 Dollar with the trendline and horizontal resistance. If APe breaks this one, we'll have the BARR confirmed, in the meanwhile you can keep your APE staked for quite a lot of APY.
Resistances on the chart, my TP1 and TP2 on the chart.
APEUSDT trade ideas

$apeusdt new trading ideahello everyone,
as you all know our previous chart worked well. now its time for new game plan.
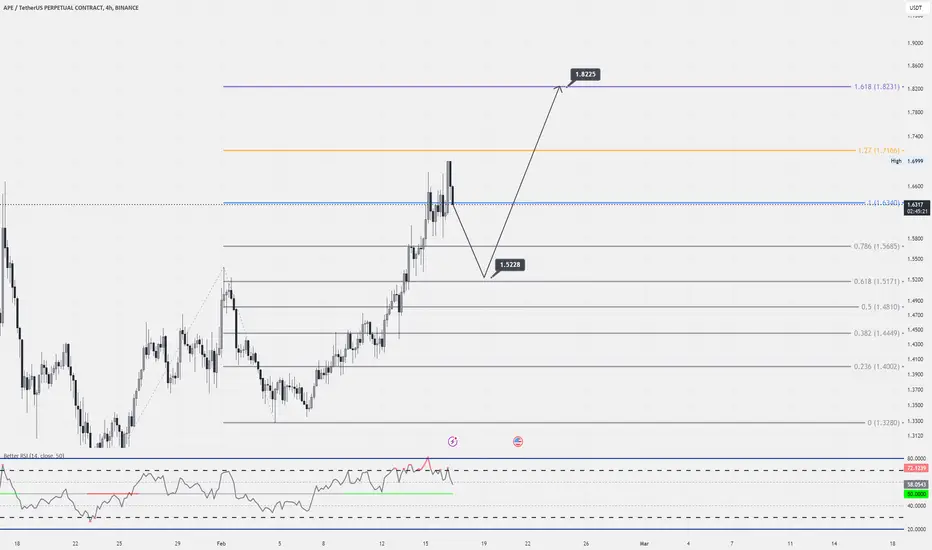
as you seen on the chart, GETTEX:APE may give %15 short and %50 long opportunity. pls do not rush to short, wait for confirmation such as MSB etc. once again we will not sit on short for a long time,once we reach %10-15 profit, pls exit your short and wait for long entry price.
I will manage my trade based on the prices that I mentioned on the chart.
enjoy

APE/USDT Primed for a Bullish Break from Key Demand Zone? 🚀💎 Paradisers, gear up for a captivating shift in #APEUSDT, as it teeters on the edge of a bullish turnaround from a crucial demand zone.
💎 A closer look at #APECOIN indicates a budding bullish reversal after it met resistance at the $1.537 supply zone. Currently flirting with the robust demand mark of $1.276, maintaining this stance could catapult us into a dynamic bullish surge.
💎 Ready to grab every chance? Should #APE slide beneath the $1.276 demand, our sights are set on rallying from the deeper demand level at $1.030. Venturing below this point might prompt a reevaluation of our bullish stance.

APEUSDTThe signal was much earlier. As a result of the signal, the price rose by 67% and then corrected. But the targets remained, all targets based on Fibonacci levels. Long-term signal, purchases only on SPOT

APE/USDT Could APE break the resistance or Confirmed HNS ??💎 APE has recently experienced significant developments in the market. It made a perfect bounce from the demand area, and the next critical obstacle was the resistance area.
💎 Breaking through this resistance is crucial for APE to continue its upward movement. If APE successfully breaks out of this resistance zone, it could pave the way for a smoother journey toward our target at the Bearish OB area.
💎 However, in the event of failure to break through, the price may retreat to the demand area. It's worth noting that APE is displaying a potentially bearish pattern known as the Head and Shoulders pattern, with the demand area corresponding to the neckline.
💎 If the demand area is breached, confirming the HNS pattern, this would indicate a bearish momentum, potentially driving the price significantly lower, possibly back to the key support area or even lower.

APE Buy - Broke short range and weekly trend line With continuous momentum for bitcoins, alt coin will start popping up.
another example here is APE which is breaking both daily and weekly trend line and shoot up

APE...is isssh???APE shows moves...I wouldn't be surprised if the BAYC mafia club is pumpin them shitcoin. I would be really careful about the risks.
Currently moving in an uptrend with strong momentum -has broken key resistance at $1.8
This level is important to test for support.
If you want to see new highs trend must break $1.99 and $2.87(key) resistances,/i]then I will update the post for new opportunity.
The levels I'm going to set for limit orders are $1.86 (high risk) and $1.73 (low risk) .
check for updates and takes

ape going to go baliisticape broke few days ago
now there r 3 major resistances
only then a major move will come
i'd long at 2
4x for a possible 50% move up
bring me march madness

APE: Resistance BreakoutTrade setup : Price is an Uptrend. Following a bullish breakout from a Descending Triangle pattern, price reached our target of $1.80 for a +20% gain. Now it’s also broken above $1.80 to signal continuation of uptrend, with +10% upside potential to $2.20 next.
Trend : Uptrend across all time horizons (Short- Medium- and Long-Term).
Momentum is Bullish (MACD Line is above MACD Signal Line and RSI is above 55).
Support and Resistance : Nearest Support Zone is $1.50 (previous resistance), then $1.25. The nearest Resistance Zone is $1.80, which it broke, then $2.20.

APEUSDT - Bullish BreakoutThe coin has recently given bullish breakout but making a HH. Its retracing now which can go till 0.38 Fib level where buy limits can be placed with SL defined below recent LL.
How do u feel about this idea?

APE/USDT Bullish Surge from Demand Zone? 🚀 APE Analysis 💎 Paradisers, get ready for an electrifying trading opportunity with #APEUSDT, indicating a bullish continuation from its lively demand zone.
💎 As we navigate the path of #APECOIN, it has been moving within a descending channel. Recently, it broke above the significant supply level at $1.848. This breakout suggests a bullish continuation from a retest level, transforming supply into demand and heightening the likelihood of a strong bullish movement.
💎 Should the momentum behind #APE begin to diminish, look forward to a vibrant comeback from the solid demand level at $1.512. Given the liquidity present in this area, we remain hopeful for a bullish climb from the Bullish Order Block. Yet, dropping below this critical juncture could hint at a deeper bearish direction.

Apeusdt trading opportunityAPEUSDT is presenting a substantial bullish opportunity following a price decline from a rising wedge pattern, subsequently stabilizing and maintaining a crucial trendline that is effectively serving as a strong support level.
The trading plan involves re-accumulating the coin within the designated buy-back zone, with an aim to pursue the targets outlined on the chart. It is imperative to establish a stop-loss order beneath the $1.248 threshold to mitigate risk.
Feedback and insights on this analysis are welcomed.

APE will continue to rise according to the double bottom structu📊#APE will continue to rise according to the double bottom structure📈
🧠We entered the correction stage after breaking through the previous high, and re-constructed a double bottom long structure in the buying zone. If everything is as expected, then there is a high probability that we will continue to break through the previous high.🙏🎯✔️
Let's see👀
🤜If you like my analysis, please like 💖and share it💬
💕 Follow me so you don't miss out on any signals and analyze 💯

APEUSDT we are waiting to open position By SMC analysis, we can see that we are waiting position on order block. Good luck to everyone

APE UPDATE (4H)This analysis is an update of the analysis that you can see at the bottom of this page, in the related analysis section
APE has some weakness in momentum. With recent data, its wave scenario has become more clear.
It seems to be inside a diametric that is now in the F wave of this diametric.
Wave F is expected to end in the green range and then APE will enter a bullish wave G.
TP is marked on the picture.
Closing a daily candle below the green range will violate the analysis
For risk management, please don't forget stop loss and capital management
Comment if you have any questions
Thank You

APECOIN TO 6.4$ (278%)This is my analysis for APECOIN we have AB=CD pattern
the target 1 is 6.42
I expect APECOIN can hit ATH and make new ATH this year.

Maybe the second step is more important, have capital in your baThis currency is near its resistance range, so the possibility of a price reversal is not far from expected. As you can see, it is in an upward trend, so we can have a risky entry.
Follow us, it makes us happy

APEUSDTApe Coin has recently demonstrated a notable movement by surpassing and subsequently closing above its EMA50, thereby indicating a prospective opportunity for mid-term growth. Confirmation of this potential upturn would be attained with a closure above the EMA 100; however, this milestone has yet to be achieved. Noteworthy indicators include the presence of a bottom pattern, sustained average trading volume, and a robust RSI. While these signals are favorable, paramount importance lies in assessing the prevailing market cycle.

APE Has broken above 1.850APE Has broken above 1.850, the pullback might be very short due to the strong Bullish engulfing candle.
🔵Entry Zone 1.769 - 1.835
🔴SL 1.6361
🟢TP1 1.9198
🟢TP2 2.1440
🟢TP3 2.3661
Risk Warning
Trading Forex, CFDs, Crypto, Futures, and Stocks involve a risk of loss. Please consider carefully if such trading is appropriate for you. Past performance is not indicative of future results.
If you liked our ideas, please support us with your likes 👍 and comments.

$apeusdt trading idea#apeusdt may give %20 profit. I will wait to take position if its pull back.
entry and Tp are on the chart.
$APE #ApeCoin Trading IdeaAPE ApeCoin is about to melt everyone's faces? We'll see. I'm waiting for a breakout through this red resistance box. After a clean breakout and closing above the $1.898 level, there is a probability for a leg up till the next resistance at $2.821. Give me your thoughts on this trading idea.

Apeusdt... Tecnicall analysis In addition to being broken, ape has finished its downward trend in the weekly time, and I think it is prone to upward growth...
please trade with your own analysis, I am not responsible for your losses.🧏🏽♀️

APEUSDTThe APE could break out of its range here and give us a nice bullish boost.
The NFT sector seems to be regaining strength.
