Breakout - Target:2.3$1. Supertrend positiv
2. positiv accumulation
3. positiv squeeze
Targets marked with dotted lines in chart
APEUSDT trade ideas

APE Picture Perfect Accumulation 2It just doesn't get any better than this. We came up off that STB into the AR high, put in a lower high, re-accumulated into the LPS and took off upwards. We'll consolidate up here around the SOS high for a bit before we continue upwards from here

APE: Descending Triangle BreakoutTrade setup : Bullish breakout form a Descending Triangle pattern, above 200-day moving average and $1.50 resistance could signal resumption of uptrend, with +20% upside potential to $1.80 thereafter. Stop Loss (SL) at $1.40, just below 200-day MA support.
Pattern : Price is trading in a Descending Triangle pattern. Typically, a breakout will occur in the direction of the existing trend. Most traders will take a position once the price action breaks through the bottom line of the triangle with increased volume, which is when the price should decline an amount equivalent to the widest section of the triangle.
Trend : Uptrend on Short-Term basis and Downtrend on Medium- and Long-Term basis.
Momentum is Bullish (MACD Line is above MACD Signal Line and RSI is above 55).
Support and Resistance : Nearest Support Zone is $1.25, then $1.00. The nearest Resistance Zone is $1.50, which it broke, then $1.80.

APE LONG Scenario APE long Scenario.
Breakout of trendline.
Breakout of residence.
After Retest of support would be great long opportunity

APE 18.01.24It is necessary to be prepared for the dump that will occur in BTC up to around 38000, so I am thinking of entering this position only from the marked area. For spot buyers, it would be logical to buy in pieces starting from these levels.
The most ideal entry points are 1.32-1.27
The target areas will be around 1.74 and 2.38 respectively if it breaks the falling trend (red line).
What I write here serves as a note to myself. Does not include investment advice.

Cup and Handle on APE/USDT On 4H ChartApe/USDT Made Clear Cup and Handle with rejection the support .
TP 1.530
SL 1.375
Good Luck

APEUSDT 3D#APE has broken the trend line on 3-days chart. It is moving above MA50 now. I'm bullish on it. Mega pump will happen soon, Targets are:
$1.575 $1.680 $1.785 $1.936 $2.127 $2.679 and $3.556
Support: $1.233 and $1.00


APE: Descending TriangleTrade setup : Price is in a downtrend, trading in a Descending Triangle pattern. Price needs to break above 200-day moving average and $1.50 resistance in order to signal resumption of uptrend, with upside potential to $1.80 thereafter.
Pattern : Price is trading in a Descending Triangle pattern. Typically, a breakout will occur in the direction of the existing trend. Most traders will take a position once the price action breaks through the bottom line of the triangle with increased volume, which is when the price should decline an amount equivalent to the widest section of the triangle.
Trend : Neutral on Short-Term basis and Downtrend on Medium- and Long-Term basis.
Momentum is Mixed as MACD Line is above MACD Signal Line (Bullish) but RSI ~ 50 (Neutral).
Support and Resistance : Nearest Support Zone is $1.25, then $1.00. The nearest Resistance Zone is $1.50, then $1.80.

APE/USDT | 1W 👀I have a very positive outlook on this coin. Soon, I expect to see its consolidation and a change in trend. It's moving within a tight range on the chart, making it difficult to forecast, but I anticipate significant growth.
ApeCoin - the token is rising in price amidst the NFT hype of the Bored Ape Yacht Club project. However, it doesn't bring any real value to the industry, similar to 'meme' cryptocurrencies. Such coins are typically overbought after any significant surge, especially if it occurs against market dynamics.
- Not financial advice, trade with caution.
✅ Stay updated on market news and developments that may influence the price of ApeCoin. Positive or negative news can significantly impact the cryptocurrency's value.
✅ Exercise patience and discipline when executing your trading plan. Avoid making impulsive decisions driven by emotions, and adhere to your strategy even during periods of market volatility.
✅ Remember that trading always involves risk, and there are no guarantees of profit. Conduct thorough research, analyze market conditions, and be prepared for various scenarios. Trade only with funds you can afford to lose and avoid excessive risk-taking.
#Crypto #ApeCoin #Investment #APE


Clear Downward TrendIn the weekly timeframe, APE shows a clear downward trend with lower lows and highs. Its recent rise was brief, reversing after meeting significant resistance.
In the daily timeframe, the downtrend continues. Price has reached a critical support (blue zone). If it falls below this, expect further decline. However, a rise above the orange zone (the last downtrend peak) could indicate a trend reversal.

APE ANALYSIS🔮 #APE Analysis 💰💰
🌟🚀 As we can see that #APE is following a descending trendline since many days in 3D time frame. Currently #APE is trading in a parallel channel. Broken out could lead to a relief bullish rally 📈📈
🔖Current Price --- $1.428
🎯Target Price -----$5.821
⁉️ What to do?
- We have marked some crucial levels in the chart. We can trade according to the chart and make some profits in #APE . 🚀💸
🏷Remember, the crypto market is dynamic in nature and changes rapidly, so always use stop loss and take proper knowledge before investments.
#APE #Cryptocurrency #DYOR

ape starting second wave going from 1.3 towards 2 usd as a first target
votes started for ape chain
donkey dash gonna be released soon
thi sis bullish news

APEUSDT IDEAUPDATE
Broken Falling Wedge in 12H TF.
Can rise 40-45% in continuation !!!
COIN DETAILS
ApeCoin price moved +2.35% over the last 24 hours. The APE to USD conversion rate is currently $1.30 per APE and the circulating supply of ApeCoin is 607,970,310 APE. Therefore, the current ApeCoin market cap is $790,361,403.

🔥 APE Moonshot Trade: HUGE OpportunityI've been keeping a close eye on APE ever since it launched. It has seen a massive sell-off after the initial launch on Binance, but has potentially stabilized.
As seen on the chart, APE has been forming a long-term falling wedge. In my view, this falling wedge (with a 95% sell-off) could potentially be the slingshot idea that APE has been waiting for. Key indicator is that the resistance of the wedge has been retested as support.
This is a long-term trade, so don't expect the target to be reached within the next year at least.
I'm aware my view on the markets have been largely bearish recently, but that does not mean that there are no bullish opportunities in the market.

APEUSDT is ready to breakoutAPEUSDT is ready to breakout near in 1.410.
It's better to enter the market using 2/10 portion of the budget, to anticipating the market back to down. In that the case, we still have 8/10 portion of budget to do Averaging technique in the future.
Use the Spot Market as usual.
I'll update it later for the exit market.

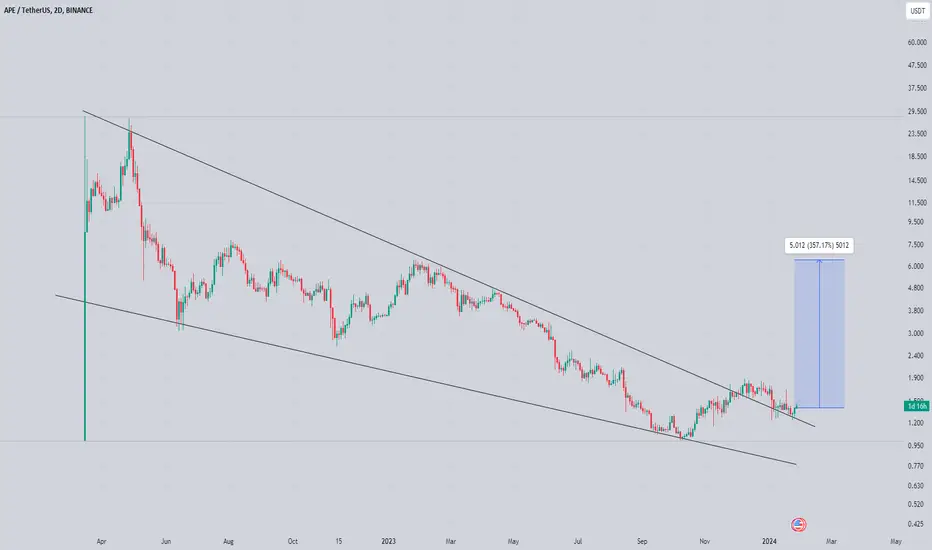
seems like ape is ready for reversal seems like has already bottomed out and preparing for solid reversal
falling wedge breakout and retest has already confirmed and seems like ready for bullish rally towards 5$ in coming days
expecting solid recovery in midterm
APE has been a huge disappointment! Will it keep going down?FWB:APE has been going down for months now and it seems like it has more downside. I looking for the H4 FVGs on the charts possibly we can see it going slowly towards there unless we a bullish news for APE.
If this support doesn't hold APE will create new lows.

APE/USDT 200-350% upward almost year APE trend going down , been 100 days in accumulation phase slowly volume going up predicting big move from here as BTC will be sideways for coming weeks, give more time for few ALTs didn't move to finish cycle
entry at green box
stoploss below last swing low

APE TRADING SETUPHi Everyone!
APE Tading setup today
APE Analyze ( APEUSDT.P ), 1 Hour time frame ⏰
APE looking good to buy, if you want to BUY APE, you can BUY in RETEST AREA
but, Don't forget set up your trading plan, risk reward
Good luck Guys!
*Follow For More!
*DYOR

APE: Approaching ResistanceTrade setup : Trends are mixed and price is at a critical juncture. Following a bearish breakout from a Channel Up pattern, price is trying to break back above 200-day moving average and $1.50 horizontal resistance zone. If it succeeds, it could signal resumption of uptrend with 33% upside potential to $2.00. If it gets rejected, it could signal bearish trend reversal near-term with downside risk to $1.00.
Trend : Neutral on Short-Term basis, Uptrend on Medium-Term basis and Uptrend on Long-Term basis.
Momentum is Mixed as MACD Line is above MACD Signal Line (Bullish) but RSI ~ 50 (Neutral).
Support and Resistance : Nearest Support Zone is $1.00. The nearest Resistance Zone is $1.50, which it broke, then $2.00.
