APE: Channel UpTrade setup : Price is trading in a Channel Up pattern. Swing traders: can enter near Channel support trendline (~$1.70) and exit near Channel resistance trendline (~$2.00). Stop Loss (SL) at $1.45. Also, price needs to break above 200-day moving average to confirm a bullish trend reversal to an Uptrend.
Pattern : Price is trading in a Channel Up pattern. With emerging patterns, traders who believe the price is likely to remain within its channel can initiate trades when the price fluctuates within its channel trendlines. With complete patterns (i.e. a breakout) – initiate a trade when the price breaks through the channel’s trendlines, either on the upper or lower side. When this happens, the price can move rapidly in the direction of that breakout.
Trend : Uptrend across all time horizons (Short- Medium- and Long-Term).
Momentum is Mixed as MACD Line is below MACD Signal Line (Bearish) but RSI ~ 50 (Neutral).
Support and Resistance : Nearest Support Zone is $1.50 (previous resistance), then $1.00. The nearest Resistance Zone is $2.00, then $2.50.
APEUSDT trade ideas

APE %83 TO %121 PROFIT CHANCEAPE is about to break cup and handle formation lets watch if it is gonna reward us or not.

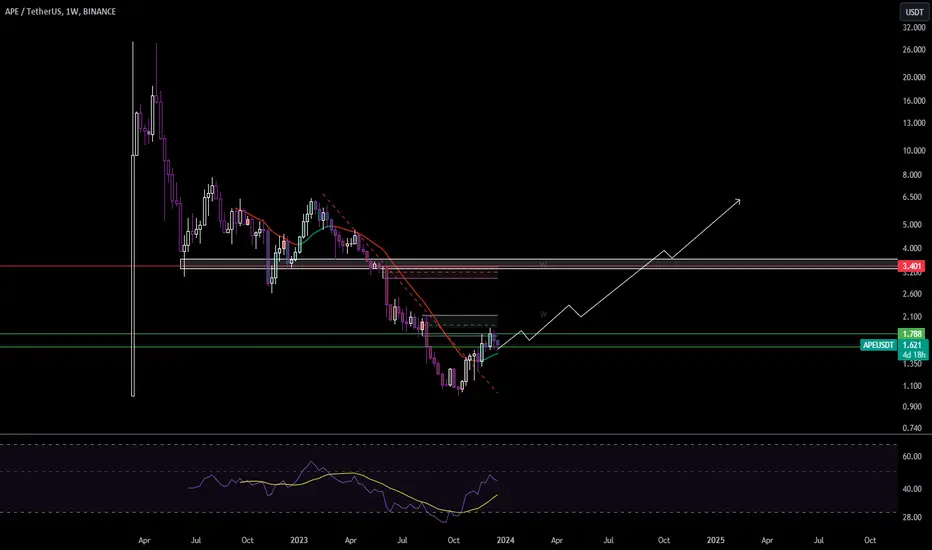
Ape looks interesting BINANCE:APEUSDT
Month. Little data. But there are strong signals to continue growing.
Week. Strong resistance here, if broken there will be a very strong move up, but the index is still short, money flow in the red zone, sales are going. If buyers are at 1.2 then hold. Or place a limit order here, good price.
3 days - also at resistance and looks weak of course, no buyers here. But! There is a lot of manipulation, pushed down hard. Breakout will happen for sure, but not a fact that soon.
Daily is weak, growth due to Bitcoin. If consolidates above 1.73 - then there is a probability to go further up.

APE: Channel UpTrade setup : Price is trading in a Channel Up pattern. Swing traders: can enter near Channel support trendline (~$1.50) and exit near Channel resistance trendline (~$2.00). Stop Loss (SL) at $1.45. Also, price needs to break above 200-day moving average to confirm a bullish trend reversal to an Uptrend.
Pattern : Price is trading in a Channel Up pattern. With emerging patterns, traders who believe the price is likely to remain within its channel can initiate trades when the price fluctuates within its channel trendlines. With complete patterns (i.e. a breakout) – initiate a trade when the price breaks through the channel’s trendlines, either on the upper or lower side. When this happens, the price can move rapidly in the direction of that breakout.
Trend : Uptrend across all time horizons (Short- Medium- and Long-Term).
Momentum is Mixed as MACD Line is below MACD Signal Line (Bearish) but RSI ~ 50 (Neutral). MACD Histogram bars are rising, which suggests that momentum could be nearing another upswing.
Support and Resistance : Nearest Support Zone is $1.50 (previous resistance), then $1.00. The nearest Resistance Zone is $2.00, then $2.50.

APE analysis in daily time frameAccording to the analysis of the chart structure in the daily time, it seems that we are at the beginning of an upward moving lag, which can be seen from its signs.
1. Break and create a flip surface
2 Construction of higher floors
He pointed out that due to the closeness of the price to Philip's level, it is possible to enter into a purchase transaction at the market price

APEUSDT LongThis idea reflects my personal opinion and is not financial advice. Please conduct your own research before making any decisions.

ape 1hsymmetrical triangle on BINGX:APEUSDT.P timeframe:1h
You can enter the trade from any side after the triangle breaks and place your loss limit in the middle of the triangle

APE could potentially price another 60% I bet his whale will firApe lost enough of its valuation after the staking program and irregular unlocks. It is one of the worst performing coins from the bear period of the market. I'm sure the project is still not unclaimed. I can't say anything about the long plan but soon Ape will make a rally not to be forgotten.
So first the target regions:
TP1: 2.86$
TP2: 4.16$
Let's fire it up!
Be prepared for any situation - enter a stop order for a rising sub-trend close or 1.57$


#APEIn the daily time, it is moving in a medium-term ascending channel. In the 4-hour period, it is moving in a short-term downward channel, which if it faces a negative reaction in the specified range, it can continue to correct until the bottom of the short-term and medium-term daily channel.

APE: Channel UpTrade setup : Price is trading in a Channel Up pattern. Swing traders: can enter near Channel support trendline (~$1.50) and exit near Channel resistance trendline (~$2.00). Stop Loss (SL) at $1.45. Also, price needs to break above 200-day moving average to confirm a bullish trend reversal to an Uptrend.
Pattern : Price is trading in a Channel Up pattern. With emerging patterns, traders who believe the price is likely to remain within its channel can initiate trades when the price fluctuates within its channel trendlines. With complete patterns (i.e. a breakout) – initiate a trade when the price breaks through the channel’s trendlines, either on the upper or lower side. When this happens, the price can move rapidly in the direction of that breakout.
Trend : Downtrend on Short-Term basis and Uptrend on Medium- and Long-Term basis.
Momentum is Mixed as MACD Line is below MACD Signal Line (Bearish) but RSI ~ 50 (Neutral).
Support and Resistance : Nearest Support Zone is $1.50 (previous resistance), then $1.00. The nearest Resistance Zone is $2.00, then $2.50.

5000 to 60000Hello, dear traders, in the continuation of the challenge of 5000 to 60000 dollars, I went to a cryptocurrency that has the potential of high growth with big investors. I buy with pullback in green lines and sell in red lines according to the market conditions
APE: Channel UpTrade setup : Price is trading in a Channel Up pattern.
Swing traders: can enter near Channel support trendline (~$1.50) and exit near Channel resistance trendline (~$2.00). Also, price needs to break above 200-day moving average to confirm a bullish trend reversal to an Uptrend.
Pattern : Price is trading in a Channel Up pattern. With emerging patterns, traders who believe the price is likely to remain within its channel can initiate trades when the price fluctuates within its channel trendlines. With complete patterns (i.e. a breakout) – initiate a trade when the price breaks through the channel’s trendlines, either on the upper or lower side. When this happens, the price can move rapidly in the direction of that breakout.
Trend : Uptrend on Short- and Medium-Term basis and Neutral on Long-Term basis.
Momentum is Mixed as MACD Line is below MACD Signal Line (Bearish) but RSI ~ 50 (Neutral).
Support and Resistance : Nearest Support Zone is $1.50 (previous resistance), then $1.00. The nearest Resistance Zone is $2.00, then $2.50.

ape going toward 2.4ape making the last correction to be sent
toward 2.4 then we might see the last correction that will
send us toward 2.8

APECOIN Is this the end of the bearish trend?Is this the time for a quick reversal?
YES There ARE TOOO MANY Targets on CHART - This is intentional.
Among many other coins, this one is also very low in price right now.
For sure the NFT hype is over... and it dropped and dropped ...
Will it continue dropping..?
ApeCoin
A token made to support the evolution of art, gaming, entertainment, digital and physical events, storytelling, and everything else web3 dreams up.

📊The general direction of #APE is still bullish📈🧠We made corrections after completing the target area. The reaction after touching the neckline was good, and we also completed the adjustment of the daily K cycle. During the rebound, we broke through the short defensive point above, which means that without the short structure as an obstacle, there is a high probability that we will continue to challenge the previous high. ⚔️
🎯The mid-term target is that we hope to break through the inflection point above and start correcting again.
⚠️Note that technical analysis is for reference only, don’t forget risk management. If you find it useful, please don’t forget to follow, like and share my analysis post📤

#APEIt is moving in a downward trend, which in case of support in the specified area in the higher time, this movement can continue up to its major ceiling. Currently, a corner pattern has been formed that this compression can be broken from above, which in case of failure, as mentioned, can continue its growth up to the specified range. In addition, if the candle closes below the range, this analysis will be invalidated.


Ape Hi,
Buy on green
Sell in Red
Bye
Disclaimer: Important Trading Disclaimer
The content and ideas shared on my account are for informational purposes only and should not be considered as financial advice. Trading involves risks, and decisions to buy or sell financial instruments should be based on careful consideration of your own financial situation, risk tolerance, and investment objectives.

ape coinOpportunity to buy for heavy profits of this currency
Buy before it's too late
ARZDASHT always with you

APE: Channel UpApe Coin (APE) technical analysis:
Trade setup : Price is trading in a Channel Up pattern. Swing traders: can enter near Channel support trendline (~$1.50) and exit near Channel resistance trendline (~$2.00). Also, price needs to break above 200-day moving average to confirm a bullish trend reversal to an Uptrend. (set a price alert).
Pattern : Price is trading in a Channel Up pattern. With emerging patterns, traders who believe the price is likely to remain within its channel can initiate trades when the price fluctuates within its channel trendlines. With complete patterns (i.e. a breakout) – initiate a trade when the price breaks through the channel’s trendlines, either on the upper or lower side. When this happens, the price can move rapidly in the direction of that breakout.
Trend : Uptrend on Short- and Medium-Term basis and Neutral on Long-Term basis.
Momentum is Mixed as MACD Line is below MACD Signal Line (Bearish) but RSI ~ 50 (Neutral).
Support and Resistance : Nearest Support Zone is $1.50 (previous resistance), then $1.00. The nearest Resistance Zone is $2.00, then $2.50.

APE/USDafter taking profit at 1.5, closing candles above and multiple retest of the 0.5 LVL price show start the move toward next higher LVL witch is around 2.412 per BTC also still at lows that is why i pick this for a long.

apeusdtSupport and press the rocket to cheer me up
Observe the ten percent loss limit
Stay away from Bitcoins
Feel free to buy and sell and post your comments
