ApeEnjoy the rides .ape movement in that pattern. Nadaraya is working exactly working ans asking to buy
APEUSDT trade ideas

$APEUSDT Scalping A 4% scalping trade on $APE
Enter : once braking up the downtrend channel
SL : 3.550
Target : 3.700

APEVery simple ... Very clear!
Everything is marked on the chart.
This is my personal opinion. Please do not trade based on my analysis and data.

APE scalp longIt seems there is an opportunity for a quick scalp on APE if price retests the 3.583 to 3.600 zone and bounces.
The market maker moves in three's and we can clearly see on the hourly chart that we had rise level 1, retrace, rise level 2, retrace and now we are on rise level 3. I think wave traders would say we are on wave 5.
Of course, if you don't believe that price is under the control of market makers, then there's nothing to see here ;-)

$APE - something like thisHello my Fellow TraderZ,
As like many other #ALTS , $APE is also looking WEAK despite strong moves few days earlier.
Here is my projection on #APE in coming days. Also this idea is still very much in play but if the market decides to SHORT SQUEEZE first then I guess major resistance for #APECOIN comes near $5.40.
Have it on radar.
Happy Trading. CHEERS!!!

ApeCoin shortApeCoin broke trough the ascending trendline. Asset broke trough the support level. Bearish movement to support level at 2.87 is possible.

🔥🚀APE WILL SKYROCKET AFTER THIS FALSE BREAKOUT🔥 Hi friends! APE is a very volatile altcoin that gives the best possibility for traders to make money even in a short-term period.
I expect the local pump on crypto after some pullback. The best time to open a long trade on APE is a false breakout of the $3.25 key level.
📊 PRECONDITIONS TO OPEN A LONG ON APE:
🔥 false breakout of the key level of $3.25
🔥 volume growth
🔥 bullish BTC
✅ THE LONG TARGETS FOR APE:
1. $3.9-4.1 - value area
2. $4.6 - a key level
3. $5.2 - key level and local high
🚩 Traders, the market is very weak now, and if you will see the bearish BTC sentiment, I recommend you to book most of your profit and put sl in a breakeven.
Also, I recommend you to open a short if you will see the sign of trend reverse. Altcoins fall really good at that stage of the market cycle and our shorts will be very profitable.
💻Friends, press the "boost"🚀 button, write comments and share with your friends - it will be the best THANK YOU.
P.S. Personally, I open an entry if the price shows it according to my strategy.
Always do your analysis before making a trade.


APE/USDTSince last month, the APE/USDT pair has dropped 67% and marked a new low of $3.13. This downfall respects a descending trendline which provides a dynamic resistance to coin price. However, a potential bullish reversal from $3.2 support may challenge this resistance trendline for recovery opportunity.
Key points:
A bullish breakout from the dynamics OBV indicator and brakeout may drive APE price by 145%
The 50 EMA assists sellers in maintaining the ongoing downtrend.
The intraday trading volume in Apecoin is $407.6 Million indicating a 50.8% gain.

APE. Doesn't make sense until the Metaverse launches.In the spring of 2023, giant amount of tokens unlock reserved for Yuga Labs and BAYC founders begin. Add to this the start of staking, where the happy bored ape NFT owners and whales will earn income. Descending triangle target is exactly worked out. From now on, I only foresee a downward movement, since there is no token utility for other than selling.

ApeCoin APE prediction for the end of the year previews forecast
APE/USDT short
Entry Range: $4.20 - 4.50
Price Target 1: $3.70
Price Target 2: $3.30
Price Target 3: $2.75
Stop Loss: $5.25

APE/USDT waiting for breakoutHey, guys
Another coin that we will be looking at is going to be APE coin. We see a good possibility for a breakout here and once we get it we would enter with a short-term long position here.
If you like ideas provided by our team you can show us your support by liking and commenting.
Yours Sincerely,
Swallow Team 🔱
Disclamer:
We are not financial advisors. The content that we share on this website are for educational purposes and are our own personal opinions.

Bull pattern. Triangle breakdownOn the graph we can see how the bullish pennant pattern was formed. I expect a breakdown of the upper boundary and growth to the nearest resistance level of 3.58-3.6$

APEUSDT 4 HOUR CHARTBullish hammer found on 4 hour chart of APEUSDT, target have mentioned as per analysis.

APEUSDT Downward ChannelWe have a pretty clear downward channel for the moment and to be honest this doesn't look too impressive. I am staying semi-neutral as we have a strong volume node above us, but we could roll to the downside pretty fast. Not financial advice, DYOR

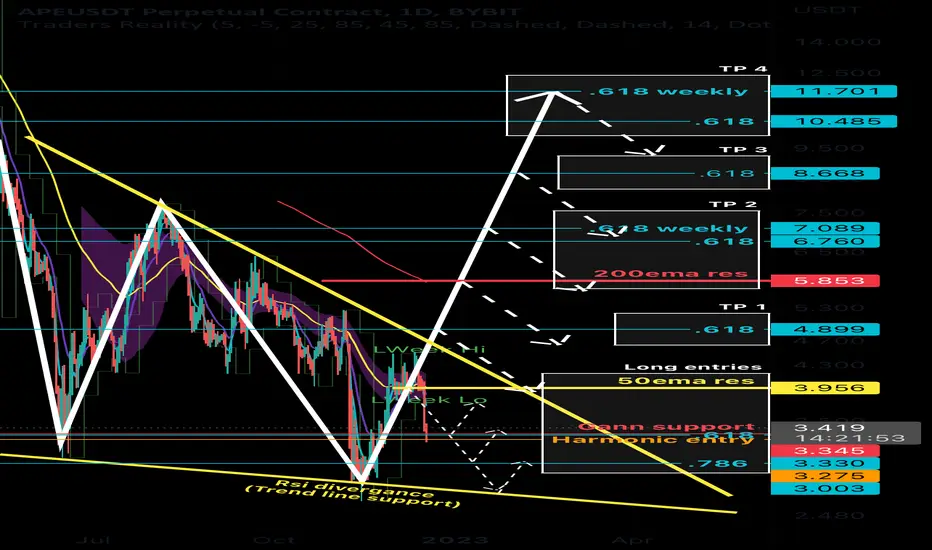
APE - Potential LONG - DailyTF - Bybit: APEUSDTPERP Trading view post:
Trade Status: ACTIVE
Trader: Drizzzled (AUS)
Trade Type: LONG
(RE-ENTRY/DCA/LADDER previous entry post
Entry 1: 3.424 (entry 1 box options)
-if missed focus on next entries. Don’t stress.
Entry 2: 3.33 “”
Entry 3: 2.70 “”
Entry 4:
Entry 5:
Entry 6:
Entry 7:
Stop Loss/ladder entries:
Entry 1:
-slightly below your re-entries
-5-10% move from your chosen entry 1
-slightly above/below entry/key resistance
-1:1 or to own personal risk factor
Entry 2: “”
Entry 3: “”
Take Profit Targets:
-4.899
-5.853
-7.089
-8.668
-11.701
Comments:
-move stop loss to break even once target 1 is hit. DCA entries above/below if stop loss is hit.
-emas will rise/drop with time so shift tp accordingly. If we re-enter higher/lower our same emas become our take profits. Also i have put boxes around key supports which I may choose to take earlier or later profits at too.
-by all means you can long from the daily open to these higher target ‘short’ entries.
-you don’t have to enter at ‘entry 1’ if you would rather enter higher.
-level 1,2 or 3 ,pumps/moves, can go higher and create new levels, hence the re-entries. It’s a shorter time frame strategy.
Ape coin show weaknessApe coin show weakness , start down trend that target level 3.380 close above 4.14 cancel this idea

Ape coin staking has started but the near future looks bleakApe coin staking started with great success for Yuga Labs and BAYC members. However, the macro economic conditions put additional stress on the Ape coin especially if it leads the members to cash out their stake rewards consistently. It will create consistent downward price pressure on APE. Technicals indicate price action to revisit under $3 again.

APE long @ 3.650 10x leverageAPE has hit a major area of support as the TOTAL and BTC bottom out in momentum once again.
This coin is far beneath the Keltner Channel and I believe with the past confluence of price action in this area we'll find support to retest back into the channel.
We're far underneath our 200-day EMA and I believe we will retest it as resistance.
We are seeing a massive floor forming in the TOTAL and APE 1-hour charts.
We have no bearish Ichimoku cloud resistance in the local area.
I may add onto this position as time goes on.

APE LONG.Trying to scalp APEUSDT. Looks like we gonna see some kind of bounce before we'll head lower and APE seems ready to make some moves to the upside. Tight stop loss so not much risk involved.
Taking profits from 4.22 till 4.29
SL 3.92 breakdown

APE/USDT(All the ranges you need to know)Apecoin showed increadible gains after hitting the 2.9$ zone.Now its trading around 4$ and facing selling preasure.Its important to break the Descending triangle to pick the next big rally.
The RED lines are indiacting RESISTANCE zones which are :4.223,4.619,5.041,7.517$
The GREEN zones are indicating SUPPORT zones which are :3.5,2.922$
Trade range by range to avoid liquidation and losses.
Thank you,STAY SAFE.

long APE$APE bounced off the support level and broke though the descending trendline. Bullish movement to resistance level at 4.41$ is likely to happen.

APEUSDT Support And Resistance The Final UpdateThe price reacted to all the ranges announced and specified in the picture.
