#APE/USDT#APE
The price is moving in a bearish channel on a 4-hour frame and is adhering to it well. The price has rebounded from the green zone and is expected to retest it at the price of $1.0
We have a tendency to stabilize above the Moving Average 100
We have an uptrend on the RSI indicator to support the rise
Entry price is 1.00
The first goal is 1.32
The second goal is 1.50
The third goal is 1.75
APEUSDT trade ideas

Ape Looking StrongEntered leveraged Long under 1.2050.
Looking strong holds here and this can send easy.
Closing if clean breaks the area marked
Note: Not a Financial advise.

apeusdtBINANCE:APEUSDT
We can see that APE has been in a downtrend since its last high in April 2022. After that, it started to decline and formed a descending channel. We are now approaching the previous low, and it seems that the bearish momentum is decreasing. Additionally, we can observe oversold conditions on the RSI indicator:
so there is one scenario, it will happen
scenario 1: if we close a weekly candle above the previous support level; the price will go up to the middle of the channel.
scenario 2 : if we close a daily candle below the First offering price, we will form a new low for APE.
Please like and comment so that I can continue.

APE ON ANOTHER DIMENSION - POSSIBLE ALL TIME LOW
I will not be surprised if BINANCE:APEUSDT make a new all time low from where price is making this update a counter scenario to the first scenario
The reason for this is because of some few important factors. One is that the community has been weak recently and that affects the fundamentals. Two, despite the move it made in the past few months, we are yet to still see volume return, not even up to one third of what we had at the all time high area which is a good indication that it only followed the ALT season hype and not necessarily it time to shine. Three, we can see that the support has become a resistance which is the first time ever that it will retest that region after it broke down on the 10th of June 2023. on top of that it is clearly looking like all the price action we had since 10th of October 2023 till the 14th of March 2024 is an Elliott Wave Zigzag ABC-orange which is the wave 4-yellow of this overall impulse which forms a very firm bearish hidden divergence on the relative strength index (RSI).
Therefore, we can expect price to make a new all time low for the wave 5-yellow.
HIGHLIGHT
- support becomes resistance with very low volume and bearish hidden divergence on the RSI
- no strong fundamentals from community
- could be the end of wave 4 and the beginning of wave 5 Elliott Wave
- possible All Time Low
OTHER ANALYSIS

APE - WHAT WILL HAPPEN AFTER THIS SHORT TERM RETRACE
Contrary to the first scenario where I suggest a new all time low, this might be what BINANCE:APEUSDT is up to. We might just be on the journey of completing the last leg down of wave Y of wave 2-yellow and then the outburst follows.
If you see this scenario as more likely, then it is ok to hold your APE or reenter at $1.562 - 1.330 region and set stop loss at the invalidation level which is the previous low or all time low.
PREVIOUS ANALYSIS
OTHER ANALYSIS

apeusdtSupport and press the rocket to cheer me up
Observe the ten percent loss limit
Stay away from Bitcoins
Feel free to buy and sell and post your comments

🦍🌟 APEUSDT: Jungle Call and MagicHey, jungle traders! Let's dive into the atmosphere of magic and mysteries of APEUSDT together! 🦍🌟
🔍 Trading Secrets:
It seems like we're approaching our magical buy zone precisely. How is this possible? Perhaps it's not just about strategies and charts, but also about some invisible hand of the market?
🌌 Mysterious Levels:
Level 1.0499 is holding strong, like a guardian at the entrance to the secret realms of the market. But what will happen when we approach this level? Will stops be lifted from below the block?
💬 Magic of Your Thoughts:
Share your ideas and predictions about what might happen next with APEUSDT! Perhaps your thought will be the key to unraveling this mysterious market puzzle! 🧠✨
💰 Best Comment Prize:
And don't forget, the best comment can win a magical prize! Let's create magic together in the market and exchange our thoughts! 🏆💬

APE raises bull flag, market is about to rise?
From a weekly perspective, APE has seen a price divergence, but it has not been reflected in the price. Representatives say there is still a lot of room for growth in the future.
Price is currently at the bottom of the trend line
and broke the downtrend line in LTF
Then I would look at the black falling bull flag as a point of concern
If the market can break through as expected, then I will pay attention to 2.883
From a weekly perspective, my final target is 7.74
Weekly divergence will cause prices to rise, which may be reflected in the next 1-2 weeks.

apeSupport and press the rocket to cheer me up
Observe the ten percent loss limit
Stay away from Bitcoins
Feel free to buy and sell and post your comments

#APE/USDT#APE
The price is moving in a downward channel on a 4-hour frame, about to break upward
The area in green is a very strong support area and the price rebounded from it at the price of 1.75
We have an upward trend on the RSI indicator
We have a higher stability moving average of 100
Entry price 2
First goal 2.12
Second goal 2.29
Third goal 2.47


📈APE: Potential Long Opportunity on 4-Hour Timeframe🚀🔍Today, our focus is on ApeCoin (APE) with analysis conducted on the 4-hour timeframe. A notable aspect in this timeframe is the favorable reactions to Fibonacci levels, where APE exhibits a response to the 0.618 level, forming a V-pattern after a fakeout. This pattern suggests a potential reversal, indicating a resurgence of buyers in the market.
💥The RSI indicator also signals positive divergence, activating a trigger for potential long positions. Now, we await confirmation from the price action to validate our entry.
📈For long positions, a breakout above $1.727 could serve as a suitable trigger, with targets set at $1.881 and $2.118. However, profit-taking should be considered along the way, given the current downtrend in the 4-hour timeframe. It's important to note that shorter timeframes may present noise and corrective moves, while longer timeframes might reveal the overarching bullish trend.
📉Regarding short positions, $1.659 presents a risky trigger, while $1.605 provides a more confident entry point. However, considering the low volume of red candles, it's less likely for the price to stabilize below these triggers unless accompanied by significant selling volume.
📝In summary, ApeCoin presents a potential long opportunity, supported by Fibonacci levels and positive divergence on the RSI. Short positions should be approached cautiously, considering the overall market sentiment and volume dynamics.
🧠💼It's important to acknowledge the inherent risks in futures trading, with the potential for margin calls if risk management is neglected. Always adhere to strict capital management principles and utilize stop-loss orders, ensuring that the initial target offers a risk-to-reward ratio of 2

APE ANALYSIS (1D)APE appears to be forming a large triangle.
Now it seems that the big wave C is over and we are in the waves of wave D.
From the green range, I expect a trend change for APE.
The targets are clear on the chart.
Closing a daily candle below the invalidation level will violate the analysis
For risk management, please don't forget stop loss and capital management
When we reach the first target, save some profit and then change the stop to entry
Comment if you have any questions
Thank You

ApeCoin (APE)On the above 4-day chart price action has corrected by 90%. Today is great long opportunity. Why?
1) RSI and price action resistance breakout.
2) Multiple oscillators print bullish divergence with price action (orange circle)
3) Price action prints on past resistance since breakout. Look left.
Is it possible price action falls further? Sure.
Is it probable? No.
Ww
Type: trade
Risk: <=6% of portfolio
Timeframe: Now, don’t sit on your hands.
Return: no idea

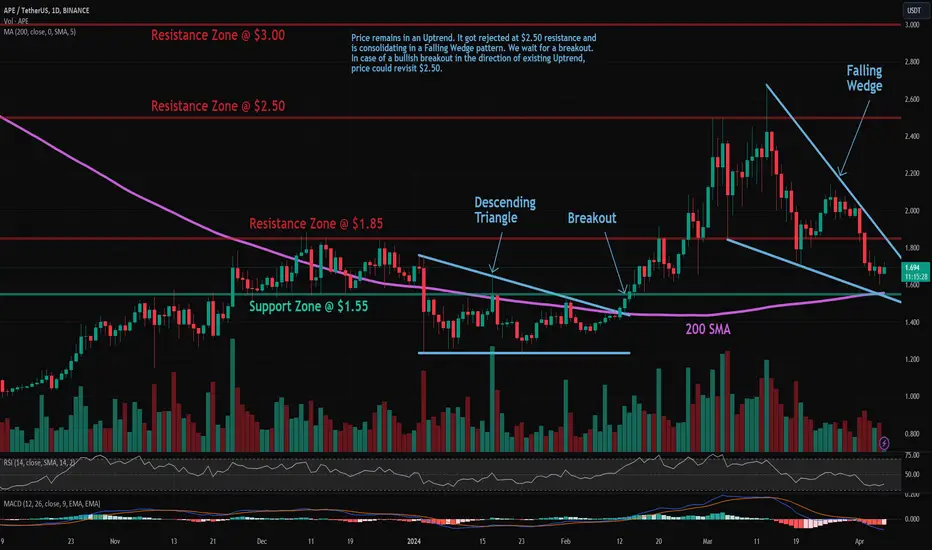
APE: Falling Wedge PatternTrade setup : Price remains in an Uptrend. It got rejected at $2.50 resistance and is consolidating in a Falling Wedge pattern. We wait for a breakout. In case of a bullish breakout in the direction of existing Uptrend, price could revisit $2.50. Also, notice that price is approaching a robust support zone around $1.55 and 200-day moving average.
Patterns : Falling Wedge . It usually forms after a downtrend and suggests a potential bullish reversal in the original downtrend. When price breaks the upper trend line the price is expected to trend higher. Emerging patterns (before a breakout occurs) can be traded by swing traders between the convergence lines; however, most traders should wait for a completed pattern with a breakout and then place a BUY order.
Trend : Downtrend on Short-Term basis, Neutral on Medium-Term basis and Uptrend on Long-Term basis.
Momentum is Bearish (MACD Line is below MACD Signal Line, and RSI is below 45).
Support and Resistance : Nearest Support Zone is $1.55, then $1.25. The nearest Resistance Zone is $1.85 (previous support), then $2.50.
APE BULLISHI will buy a bit now and more inside the green box if the price goes there. I think this is a good trade. But of course, keep an eye on BTC. Usually, the price bounces from those areas, but at your own risk.

#APE/USDT#APE
The price has been moving in a down channel since July 2022
The price adhered to the boundaries of that channel perfectly
Now we have an upward trend on two levels
Current price 1.70
First goal 3.44
Second goal 5.14

APE / USDT BULLISHSeems like ape is making a correction to the whole market factors....
We can clearly see : FVG getting filled, which means potential buy orders resting around those areas, which could give us an overall pump of 70%....

APE: Falling WedgeTrade setup : Price remains in an Uptrend. It got rejected at $2.50 resistance and is consolidating in a Falling Wedge pattern. We wait for a breakout. In case of a bullish breakout in the direction of existing Uptrend, price could revisit $2.50. Also, notice that price is approaching a robust support zone around $1.55 and 200-day moving average.
Pattern : Falling Wedge . It usually forms after a downtrend and suggests a potential bullish reversal in the original downtrend. When price breaks the upper trend line the price is expected to trend higher. Emerging patterns (before a breakout occurs) can be traded by swing traders between the convergence lines; however, most traders should wait for a completed pattern with a breakout and then place a BUY order.
Trend : Downtrend on Short-Term basis and Uptrend on Medium- and Long-Term basis.
Momentum is Bearish (MACD Line is below MACD Signal Line, and RSI is below 45).
Support and Resistance : Nearest Support Zone is $1.85, which it broke, then $1.55. The nearest Resistance Zone is $2.50, then $3.00.

apeSupport and press the rocket to cheer me up
Observe the ten percent loss limit
Stay away from Bitcoins
Feel free to buy and sell and post your comments

APE: Pullback in UptrendTrade setup : Price remains in an Uptrend. It got rejected at $2.50 resistance and pulled back, which could be another swing trade entry in Uptrend with upside potential back to $2.50. Stop Loss (SL) level at $1.68. Previously, following a bullish breakout from a Descending Triangle pattern, price signaled continuation of uptrend.
Trend : Uptrend across all time horizons (Short- Medium- and Long-Term).
Momentum is Mixed as MACD Line is below MACD Signal Line (Bearish) but RSI ~ 50 (Neutral). MACD Histogram bars are rising, which suggests that momentum could be nearing another upswing.
Support and Resistance : Nearest Support Zone is $1.85, then $1.55. The nearest Resistance Zone is $2.50, then $3.00.

APE Frenzy Time: Seize the Opportunity for Wealth!ApeCoin (APE) Fundamentals:
ERC-20 Governance and Utility Token: Used within the APE Ecosystem, which aims to be a decentralized community hub in the Web3 space.
DAO Governance: Holders can participate in the ApeCoin DAO to vote on proposals and influence the ecosystem's development.
Utility Token: Planned use cases include access to exclusive games, events, and services within the APE Ecosystem.
Total Supply: Fixed at 1 billion tokens.
Recent News (as of March 26, 2024):
Price: Around $2.10 USD, with a slight increase in the last week.
Disclaimer: I cannot provide financial advice. Consider doing your own research before making any investment decisions. The cryptocurrency market is volatile and high-risk.

APE/USDT --- Buy InvestThe chart APE/USDT indicates that the price has hit a significant low, which is followed by the influx of buyers. Over time, this buying pressure is expected to intensify, causing the price to enter a compression strong wedge pattern. Subsequently, it’s anticipated to break its short-term trend line.
Based on my analysis, this chart has a potential profit of approximately 200%.
Good luck! 👍
