API3USDT in Extended WXY Decline Key Breakout Levels in FocusAPI3USDT continues its corrective descent, unfolding into a potential WXY pattern, with price action currently extending toward the completion of leg Y. Attention is now on the Immediate Resistance Level (IRL) and the Main Support Zone highlighted on the chart.
Price is expected to remain range bound within these levels. A breakout will define the next major move, a break below support could complete the corrective structure into the Potential Reversal Zone (PRZ), while a break above the IRL may trigger a strong bullish leg toward the setup’s main upside target.
Share your thoughts on API3 in the comments!
API3USDT trade ideas

API3/USDT: The Ultimate Bounce Setup!📊 CURRENT SNAPSHOT 🔍 KEY TECHNICAL LEVELS
🟡 CRITICAL RESISTANCE ZONES
Major Resistance: $0.800 - Key breakout level
Secondary Resistance: $0.900 - Previous support turned resistance
Target Zone: $0.585-$0.536 - Golden pocket area
🔵 CURRENT BATTLE ZONE
Price: $0.664 - Testing key support
Descending Wedge: Bullish pattern forming
Volume: Declining - Typical before breakouts
🟢 SUPPORT FORTRESS
Immediate Support: $0.585 - Critical level
Ultimate Support: $0.536 - Major bounce zone
Trendline Support: Red descending line
🎯 THE SETUP: "Falling Knife Reversal Pattern"
📱 QUICK SUMMARY - Pattern: Falling Wedge (Bullish) ✅
Entry Zone: $0.52 - $0.55 🎯
Target: $0.80 - $0.90 🚀
Risk/Reward: 1:3.6 ⭐⭐⭐⭐⭐
Probability: 80% Bullish 📈

API3 loves to scam pump when DeFi coins runBINANCE:API3USDT
Mini range and trend support holding so far.
— Holding above $0.65–0.70 = base for a squeeze toward $1.40–2.00.
— Flip $1.10–1.20 = mid-term trend shift.
— Main resistance at $2.33, then macro targets $3.2–5.5.
— Lose trend support? Expect new lows inside the channel.
Key level: watch how it acts above $0.65.

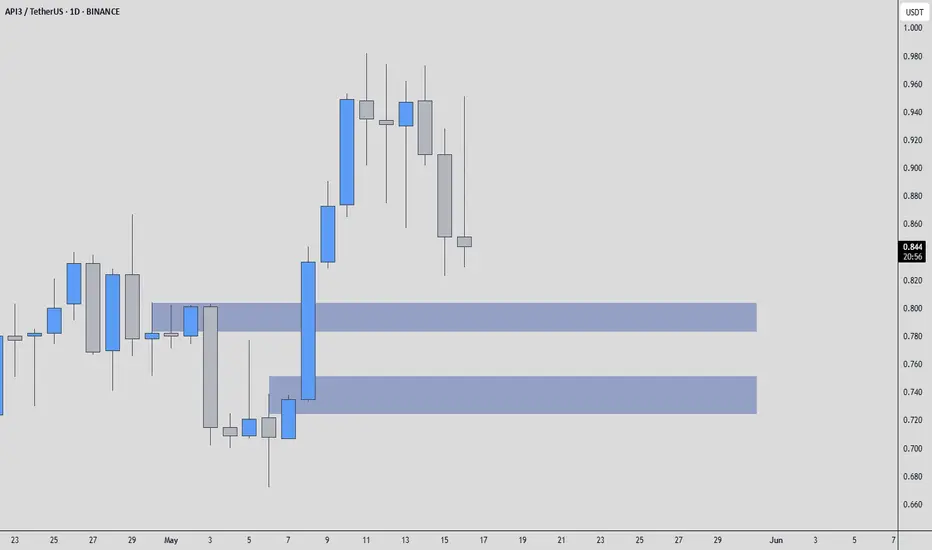
API3USDT - Looks Good!When most traders are looking at flashy pumps, I’m watching structure, confirmation, and where real buyers are hiding. In this case, the blue boxes are not just drawn for aesthetics, they represent potential accumulation zones, places where price might find its footing if approached with the right momentum and volume context.
We’ve seen this behavior before: strong drops into support, followed by subtle CDV divergence, an uptick in volume, and then a quick reclaim. That’s the kind of move that gives traders an edge, if they’re patient enough to wait for it.
But let’s be real, trading without confirmation is gambling. I say this every time: I will never insist on my long idea if the levels don’t react. If there’s no reclaim or strength in the low timeframe, I step back.
Volume, CDV, and reaction around these levels are everything. The market has been unforgiving lately, and API3 is no exception. However, these blue box zones still carry potential, if buyers show up.
📌 Stay sharp, stay flexible. This is how the highest win-rate traders operate, not by chasing, but by setting traps and waiting for price to walk in.
📌I keep my charts clean and simple because I believe clarity leads to better decisions.
📌My approach is built on years of experience and a solid track record. I don’t claim to know it all but I’m confident in my ability to spot high-probability setups.
📌If you would like to learn how to use the heatmap, cumulative volume delta and volume footprint techniques that I use below to determine very accurate demand regions, you can send me a private message. I help anyone who wants it completely free of charge.
🔑I have a long list of my proven technique below:
🎯 ZENUSDT.P: Patience & Profitability | %230 Reaction from the Sniper Entry
🐶 DOGEUSDT.P: Next Move
🎨 RENDERUSDT.P: Opportunity of the Month
💎 ETHUSDT.P: Where to Retrace
🟢 BNBUSDT.P: Potential Surge
📊 BTC Dominance: Reaction Zone
🌊 WAVESUSDT.P: Demand Zone Potential
🟣 UNIUSDT.P: Long-Term Trade
🔵 XRPUSDT.P: Entry Zones
🔗 LINKUSDT.P: Follow The River
📈 BTCUSDT.P: Two Key Demand Zones
🟩 POLUSDT: Bullish Momentum
🌟 PENDLEUSDT.P: Where Opportunity Meets Precision
🔥 BTCUSDT.P: Liquidation of Highly Leveraged Longs
🌊 SOLUSDT.P: SOL's Dip - Your Opportunity
🐸 1000PEPEUSDT.P: Prime Bounce Zone Unlocked
🚀 ETHUSDT.P: Set to Explode - Don't Miss This Game Changer
🤖 IQUSDT: Smart Plan
⚡️ PONDUSDT: A Trade Not Taken Is Better Than a Losing One
💼 STMXUSDT: 2 Buying Areas
🐢 TURBOUSDT: Buy Zones and Buyer Presence
🌍 ICPUSDT.P: Massive Upside Potential | Check the Trade Update For Seeing Results
🟠 IDEXUSDT: Spot Buy Area | %26 Profit if You Trade with MSB
📌 USUALUSDT: Buyers Are Active + %70 Profit in Total
🌟 FORTHUSDT: Sniper Entry +%26 Reaction
🐳 QKCUSDT: Sniper Entry +%57 Reaction
📊 BTC.D: Retest of Key Area Highly Likely
📊 XNOUSDT %80 Reaction with a Simple Blue Box!
📊 BELUSDT Amazing %120 Reaction!
📊 Simple Red Box, Extraordinary Results
I stopped adding to the list because it's kinda tiring to add 5-10 charts in every move but you can check my profile and see that it goes on..
API3: The Perfect Short-Term Trade Setup (174% & 289% Profits)Let me explain why this is the "perfect short-term trade setup."
You know all these Altcoins we've been tracking together they hit bottom last month, 7-April. Here API3USDT hit bottom 11-March 2025 and produced a very strong reaction. It is as if buyers were really ready to rock this one-up.
The initial bullish breakout went into retrace which is normal and this retrace ended in a higher low. So 9-April we have a higher low rather than a lower low and this support zone was found above the 3-Feb. low. Which is the session with the long lower shadow on the left.
So API3USDT went sideways after the April low—consolidation—and is now turning green. Any bullish action can result in a strong bullish jump. This is why this is the perfect chart setup. The strong reaction in March shows that interest is big for this pair. The higher low in April shows that support has been established and confirmed. Current price action opens the door for an advance any day.
The trick is to be patient. Even though it is a perfect chart setup for the short-term it can always take time before the market decides to move. Sometimes, people find a chart like this one and buy up. Prices start to grow naturally but the bots suppress the growth. Excitement dies down and people sell at a loss, but, suppression doesn't mean the end. If you wait patiently after the rush and buy FOMO crow gets out, the pair will still grow anyway. So we buy and hold and let the market take care of the rest. If you are ready to wait 1 week, prepare to wait for 1-2 months. It might sound like a lot but it is good money when you sell high after buying low. The alternative is pocketing a loss and that's a big no-no! It is better to wait and let it ride because the easiest way to win with Crypto is by knowing that the market is wild.
It can produce strong swings, it is volatile, it can shake, but, if you hold while you wait strong, profits can be great. No other market pays as much as the Cryptocurrency market, but you have to be able to detach and ignore the inevitable drops that happen. Yes prices drop, but they recover and then the recovery translates into growth. We are now facing the strongest growth phase in many years.
Thanks a lot for your support.
Namaste.

Trading opportunity for API3USDTBased on technical factors there is a Sell position in :
📊 API3USDT
🔴 Sell Now
🪫Stop loss 1.250
🔋Target 0.820
📏 R/R 1,5
💸RISK : 1%
We hope it is profitable for you ❤️
Please support our activity with your likes👍 and comments📝

API 3 Trade SetupNASDAQ:API 3 is approaching a good liquidity level. I am interested in trading it in the region highlighted in green. I am closely monitoring this region for a potential entry. If I saw a positive reaction i will take a trade.

#API3USDT is showing signs of recovery📉 LONG BYBIT:API3USDT.P from $1.1236
⚡️ Stop loss $1.1030
🕒 Timeframe: 1H
✅ Overview BYBIT:API3USDT.P :
➡️ The chart shows a gradual shift from a downtrend to possible reversal after forming strong support around $1.0680.
➡️ Price is currently attempting to break above the key resistance zone $1.1234–$1.1236, which also marks the potential LONG entry point.
➡️ Volume Profile indicates high trading activity above, with the Point of Control (POC) at $1.2541 — suggesting room for upside movement if breakout holds.
➡️ Bullish volume spikes suggest growing buyer interest.
➡️ Stop loss set at $1.1030, just below recent consolidation lows.
📍 Important Note:
Do not rush the entry!
Wait for a clear hold above $1.1236 before entering the LONG — entering too early may expose you to fakeouts.
🎯 Take Profit Targets:
💎 TP 1: $1.1362
💎 TP 2: $1.1544
💎 TP 3: $1.1707
⚡ Plan:
➡️ Watch for breakout confirmation above $1.1236
➡️ Enter LONG after volume or candle confirmation
📢 Consider partial profit at TP1 and move SL to breakeven for risk-free management.
🚀 BYBIT:API3USDT.P is showing signs of recovery — if the price holds above the entry zone, further upside is expected!

API3USDT is BullishPrice was in a downtrend, however bullish divergence appeared on daily timeframe that led to the break of previous lower high. Bulls seem to be in the driving seat as first higher high is printed, if the momentum continues then we can expect further upside in price action as per Dow theory. Targets are mentioned on the chart.

API3 looks bearish (2H)API3 has not issued a bearish trigger yet, but considering that it has hit a key resistance level, formed a base, and the base has been broken, it is expected that the price will be rejected downward during the pullback.
We anticipate a drop from the red zone downward.
Targets are marked on the chart.
A 4-hour candle closing above the Invalidation Level will invalidate this analysis.
For risk management, please don't forget stop loss and capital management
When we reach the first target, save some profit and then change the stop to entry
Comment if you have any questions
Thank You

API3USDT CHART ANALYSİS - EDUCATIONAL POSTThe NFT Concept
You may already know that each unit of value in a blockchain is called a token. In an open blockchain, all tokens are equal and interchangeable. For example, one bitcoin can be easily replaced with another, and nothing will change.
Non-fungible tokens are a game-changer, which work differently. An NFT is a digital asset that cannot be replaced with another token without changing the value and basis of the object.
Like cryptocurrency, NFTs are created on a blockchain, which acts as a database to record all transactions. The blockchain guarantees the uniqueness, safety, and anonymity of non-fungible tokens. Thanks to this system, any user can verify the originality and transparency of the history of a particular NFT through the blockchain.
When you buy an NFT token, you are obtaining a certificate for a digital or real object. However, the work itself doesn’t move anywhere. You only use its digitized file or a certificate of ownership. Once created or purchased, the token sits in perpetual storage. This certificate is just lines of code that confirm it is the token owner who has the original copy of the object.
An NFT token can be compared to a painting, which may belong to a gallery, museum, or individual, but the audience can see it in a catalog or exhibition.
NFT tokens are sold in online marketplaces that operate like Amazon. The creators put them on marketplaces and wait for bids from buyers.
An NFT token can be created by you or by anyone for that matter. To do this, you need to take a digital object (picture, music, photo, etc.), register in a particular marketplace on a platform such as Rarible or OpenSea, and upload the object with a description and price. You will have to pay a fee for creating a blockchain entry on many platforms. However, the costs pay off in most cases, as NFTs are #1 in the crypto world today.

API3USDT(Api3) Updated till 22-03-25API3USDT(Api3) Daily timeframe range. PA having a continuous pullback from its new low. 1.252 is recent resistance if it can get valid close above it, it got long way to go. local support at 0.815 if it dont breaks it will push back.

API3.DAILY.20.3.2025API3.DAILY.20.3.2025
Mua spot API3 / Long API3
Target Spot: 30%
Holdtime: 24h
Entry: 0.891 (spot)
Goodluck!

#API3USDT is setting up for a breakout📉 Long BYBIT:API3USDT.P from $0,8985
🛡 Stop loss $0,8543
1h Timeframe
⚡ Plan:
➡️ POC is 0,8185
➡️ Waiting for consolidation near resistance and increased buying activity before the breakout.
➡️ Expecting an impulsive upward move as buy orders accumulate.
🎯 TP Targets:
💎 TP 1: $0,9300
💎 TP 2: $0,9630
💎 TP 2: $0,9900
🚀 BYBIT:API3USDT.P is setting up for a breakout—preparing for an upward move!

Shorting with 7-starIntroducing our new short future indicator. while BTc is down, alt follow the bleed and 7-star catches it. with 7-star you don't have to worry about the state of the market.
DYOR
For indicator access drop a message


API3 Short-Term, High Probability Trade Setup (Easy 120%)Good afternoon my fellow Cryptocurrency trader, how are you doing today?
The Altcoins continue to recover from bottom prices.
Finding Altcoins trading at the bottom, near support, is always the best.
Once a pair is trading near its bottom it can't go any lower, which means that the only scenario left open is for prices to go up.
The best we can do is to spot these bottoms and buy early to then hold. As soon as prices start moving, within days, we can end up with a successful trade.
API3USDT is showing a clear reversal pattern, the ending diagonal.
Today, a bullish breakout is happening with really high volume. This is the highest volume daily in a year, since January 2024.
This means that prices are about to go up.
Long-term, potential for growth is huge but here we are focusing on the short-term.
There are all types of traders and trading systems. Some people are happy with patience, risk free, low stress and high profits, while others want to make money within hours or days. The market has something for everybody.
The high volume indicates that the move is real.
The fact that the low came on the 3rd of February is also a give-away signal. This is when the entire market produced a major flush. This flush cements the bottom low, after this low we get some sideways and then up.
Remember, prices can go much higher, but this is a good setup to double-up.
I am wishing you good profits and good luck.
Thanks a lot for your continued support.
Namaste.

API3USDT 6DAPI3 ~ 6D
#API3 If you still have Conviction on this coin,. This support block would be a very good buying spot for now with a target of at least 20%

Technical charting TAGALOGd : red
bb 50 below
rsi below 50
4hr: red
bb50: dt
rsi below 50
Right hand
double bottom
15: 3rd buga pababa na
bb 50 baba ng resistance line
note
- downtrend
-no excessive move tapos
na nung sunday night
price rejected on resistance
pullback waiting if bounce
bias shorting tabo tp 1.236
conservative approached entry on recent lower high for long

#API3 (SPOT) entry range ( 1.270- 1.480) T.(3.259) SL(1.238)BINANCE:API3USDT
entry range ( 1.270- 1.480)
Target (3.259)
SL .1D close below (1.238)
Golden Advices.
**********************
* collect the coin slowly in the entry range.
* Please calculate your losses before the entry.
* Do not enter any trade you find it not suitable for you.
* No FOMO - No Rush , it is a long journey.
Useful Tags.
**********************
My total posts
( www.tradingview.com )
1Million Journey
( www.tradingview.com )
( www.tradingview.com )
********************************************************************************************************************** #Manta ,#OMNI, #DYM, #AI, #IO, #XAI , #ACE #NFP #RAD #WLD #ORDI #BLUR #SUI #Voxel #AEVO #VITE #APE #RDNT #FLUX #NMR #VANRY #TRB #HBAR #DGB #XEC #ERN #ALT #IO #ACA #HIVE #ASTR #ARDR #PIXEL #LTO #AERGO #SCRT #ATA #HOOK #FLOW #KSM #HFT #MINA #DATA #SC #JOE #RDNT #IQ #CFX #BICO #CTSI #KMD #FXS #DEGO #FORTH # AST #PORTAL #CYBER #RIF #ENJ #ZIL #APT #GALA #STEEM #ONE #LINK #NTRN #COTI #RENDER #ICX #IMX #ALICE #PYR #PORTAL #GRT #GMT # IDEX #NEAR #ICP #ETH #QTUM #VET #QNT #API3 .

API3 Bullish Gartley.An oracle project whose price has been under pressure for a long time.
* What i share here is not an investment advice. Please do your own research before investing in any digital asset.
* Never take my personal opinions as investment advice, you may lose all your money.

API3 swing long 8RAPI3 making HL and HH on daily. Putting on a limit trade with final TP just below weekly trendline and SL below recent low. Aiming for a 8R trade. Entry just below daily POC.
DISCLAIMER: I am not providing trading signals or financial advice. The information shared here is solely for my own documentation and to demonstrate my trading journey. By openly sharing my process, I aim to put pressure on myself to stay focused and continually improve as a trader. If you choose to act on any of this information, you do so at your own risk, and I will not be held responsible for any outcomes. Please conduct your own research and make informed decisions.

API3/USDT Potential 100%++Accumulate under $2.3 - $1.3
Targets Points
TP 1 : $2.6
TP 2 : $3.1
TP 3 : $3.6
TP 4 : $4.2
TP 5 : $4.7
