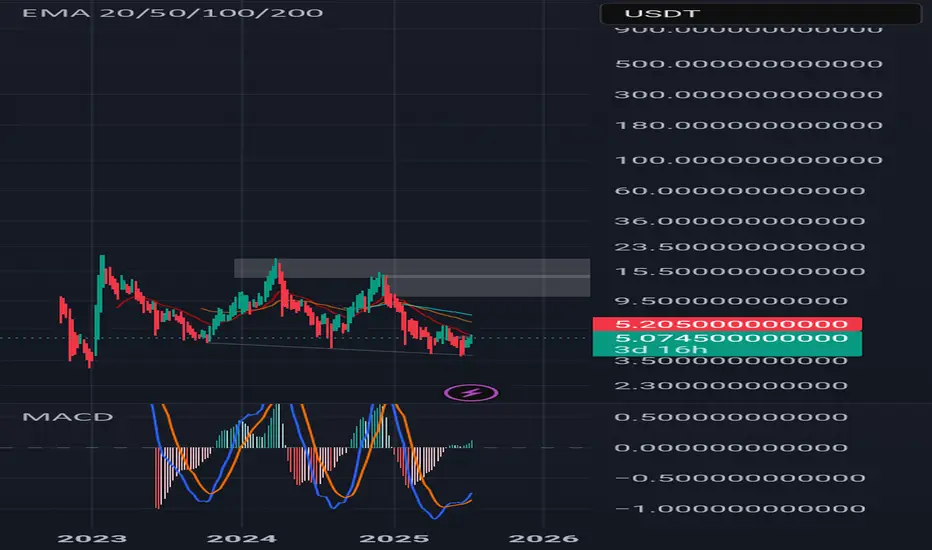
5/Altseason Live Psychology:My Core Principle,Learned Over Years
This experience is built on analyzing every previous altseason. And here is the main takeaway: altseasons are always short, but incredibly rapid. In this chaos, most people, driven by emotion, make the same mistakes:
- They open too many trades.
-They close a position on the first small move, hoping to "re-enter" another project that's "about to explode."
-They shift capital from a growing asset to one that hasn't moved yet. And it still doesn't move.
The problem is the mindset. You don't invest in what's falling or bet on "dark horses." You invest in what is already growing.
This might sound new to some, but the most important principle in trading, and in life, is to REINFORCE STRENGTH.
This is an attention market. And attention is captured by the speed and power of growth. Everyone is looking at what's pumping. That's where the money flows. Your job is to be in that flow, not to try and catch a falling knife.
And one more thing, the most critical rule for the next two months. I AM BEGGING YOU, DO NOT OPEN SHORT POSITIONS. Any 15-25% correction on a strong project is not a reason to short; it is your buying opportunity. Measure from the peak, and you will see these entry points. The strongest projects will correct even less. This system works.
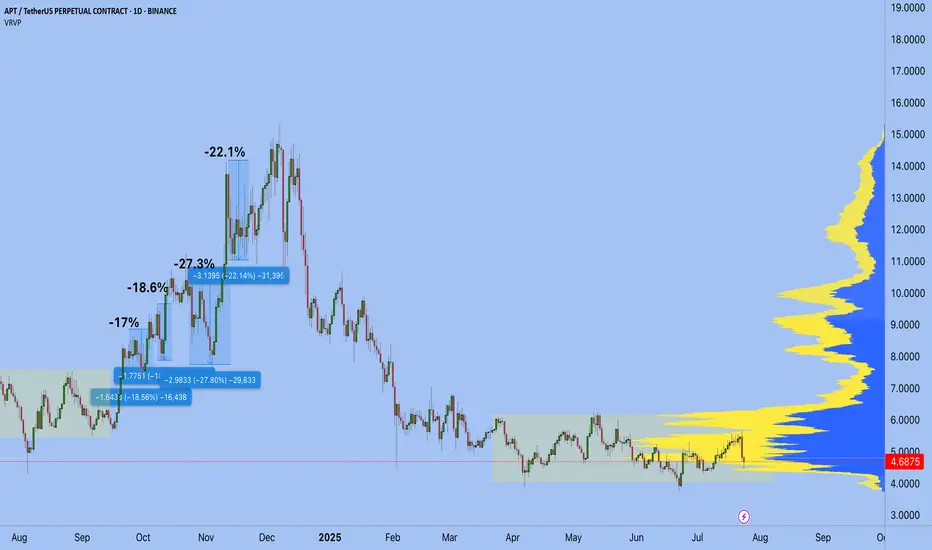
Of course, this doesn't mean blindly buying everything that's green. You need to understand the narratives. But if your project is old and showing weakness while others are flying, maybe it's time to switch to a leader. As a subscriber wrote in the comments of my last post: in the previous cycle, SUI did a 10x, while APTOS did a 4x. This clearly shows where the market's attention was focused, and consequently, where the results were.
Best regards EXCAVO
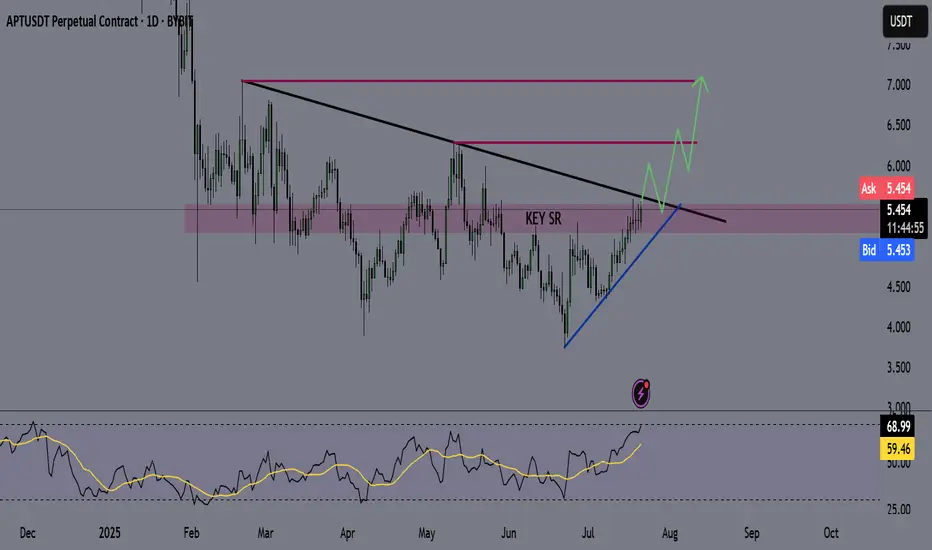
APTUSDT trade ideas
APT : Long term purchaseHello friends🙌
👀You see that the price is in a range and now we are at the bottom of the range. The scenario is simple. The bottom of the range is a good buying opportunity that can be used because 80% of the failures in the range are fake.
⚠So we can buy with risk and capital management and move with it to the specified targets.
🔥Follow us for more signals🔥
*Trade safely with us*

APT : Did the buyers arrive?Hello friends🙌
📈An ascending channel and then a descending channel and then an ascending channel.📉
✔The point is that when the price entered an ascending channel, your price entered and with a failure it entered a descending channel and you exited with a loss and again when the price is at the peak of despair you see that the main buyers enter and push the price up and cause a new ascending channel.
🔊Considering these tips we have told you, always have a trading plan and follow capital management so that you do not fall into the trap.
🔥Follow us for more signals🔥
*Trade safely with us*

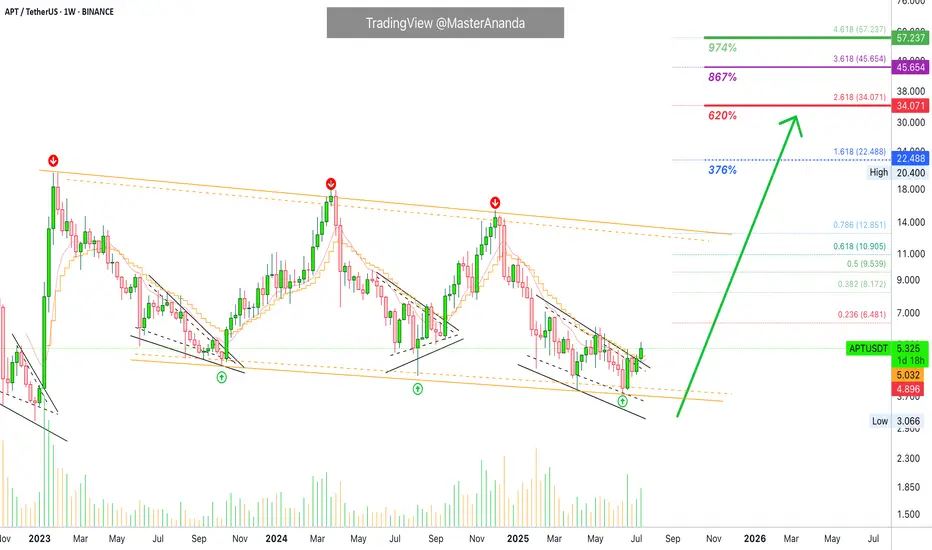
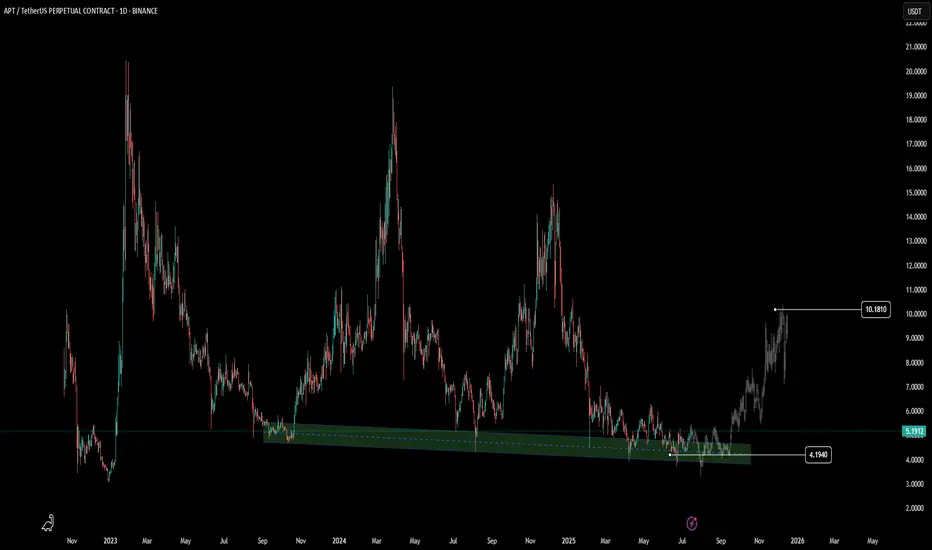
Aptos Bullish Bias Intensifies · Moving Above 2 EMAs WeeklyLast week APTUSDT (Aptos) closed above EMA8 and this week it is trading, and set to close, above EMA13. The bullish bias is becoming stronger; notice the bullish reversal pattern in black. Each time this type of pattern showed up Aptos turned bullish. This is the fourth time and it won't be different. It will be different only in the sense that the long-term consolidation descending channel will break. Instead of resistance being found and confirmed at the upper-boundary of the channel, APTUSDT will produce a new high, a higher high and a new all-time high. You are witnessing the start of the 2025 bull market cycle. Growth potential goes beyond 800%. Total growth from bottom to top can reach 1,000% or more.
Thank you for reading.
Namaste.
#APT/USDT#APT
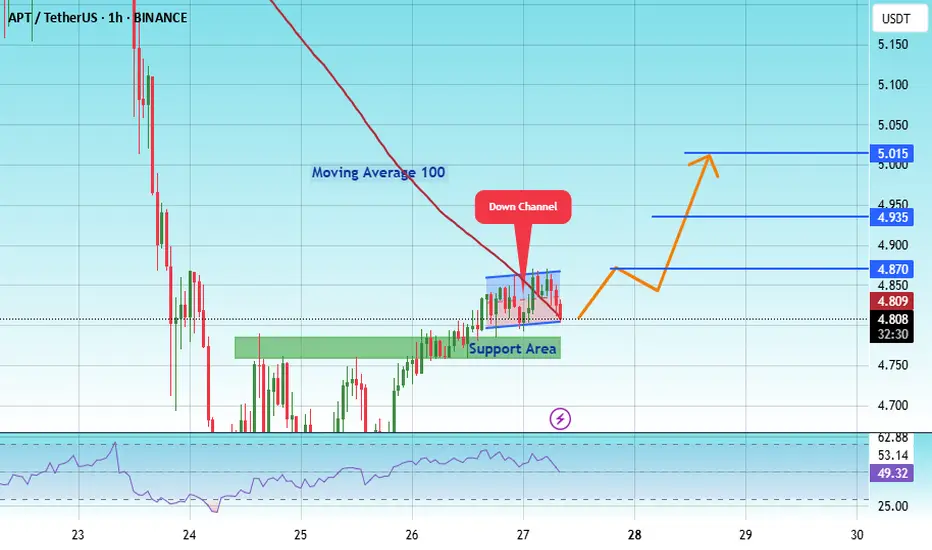
The price is moving within an ascending channel on the 1-hour frame, adhering well to it, and is on track to break it strongly upwards and retest it.
We have support from the lower boundary of the ascending channel, at 0.1560.
We have a bearish trend on the RSI indicator that is about to break and retest, supporting the upside.
There is a major support area in green at 0.1555, which represents a strong basis for the upside.
Don't forget a simple thing: ease and capital.
When you reach the first target, save some money and then change your stop-loss order to an entry order.
For inquiries, please leave a comment.
We have a trend to hold above the 100 Moving Average.
Entry price: 0.1600
First target: 0.1640
Second target: 0.1677
Third target: 0.1719
Don't forget a simple thing: ease and capital.
When you reach your first target, save some money and then change your stop-loss order to an entry order.
For inquiries, please leave a comment.
Thank you.
APT - A lower timeframe view - Breakout Entry- On 1D candle, APT is still trading inside the channel
- currently price is trading near the resistance and got rejected from the resistance as expected.
- I'm expecting few more candles near the resistance zone before breakout.
If we look at the higher timeframe (1W) view we shared earlier, there is huge potential for uptrend as we are expecting past pattern to repeat
if you are looking for a short term trade without focusing on weekly chart, this is a good opportunity
Entry Price: 5.313
Stop Loss: 3.462
TP1: 6.141
TP2: 7.270
TP3: 8.634
TP4: 10.583
TP5: 14.768
Don't forget to keep stoploss
Cheers
GreenCrypto

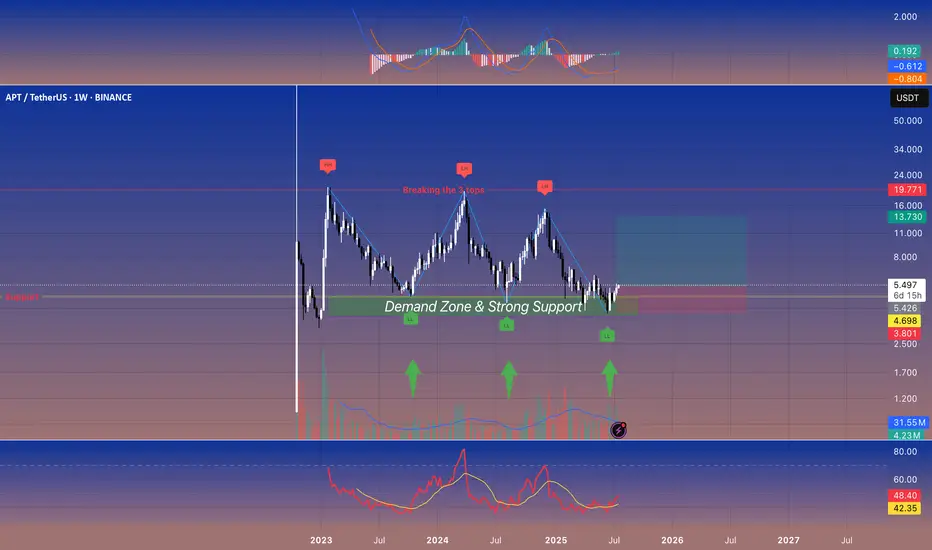
APTOS Weekly Bottom Formation — Early Signs of Reversal
APT has retested and held the long-term weekly support zone (green box) multiple times, confirming strong demand and buyer defense.
Current price action is pushing off the support with a series of higher lows, suggesting the start of a new bullish cycle.
Scenario A (Bullish):
— If APT holds above $5.40 and weekly closes stay above this green zone, expect gradual momentum toward the $15–$19 resistance (red box).
— First target is $15.30, with extension to $19.50 if trend accelerates.
Scenario B (Invalidation/Bearish):
— If price fails to hold $5.40 and breaks back below $3.40, setup is invalidated. In this case, expect retest of lower support at $3.00 or lower.
Aptos is showing a classic bottoming structure on the weekly timeframe, with clear accumulation at major support. Sellers have repeatedly failed to break the lows, while buyers step in on every dip. This increases the probability of a mid-term reversal toward the upper resistance band. Weekly structure remains bullish above support; only a major breakdown below $3.40 would invalidate the scenario.

Aptos: The Sleeping Giant🚀 Aptos: The Sleeping Giant 😴🌋
APT keeps bouncing off a rock‑solid \~\$5 demand zone. If it finally pops above \~\$7.5‑8, the giant could wake up in a hurry. 📈
---
👀 Quick‑Glance Weekly Checklist
| 🔍 Focus | What’s Happening |
| ------------------------ | ------------------------------------------------------------------------------------------- |
| **Demand Zone** 🟢 | Repeated wick rejections + volume spurts every dip into **\$5‑5.2** = buyers camping there. |
| **Structure Squeeze** 🔄 | Series of **LH ➡️ LL ➡️ reclaim** – bears push down, bulls yoink it back. |
| **Momentum Curling** 📈 | MACD & RSI‑style oscillators turning up from oversold = reversal vibes. |
| **R/R Sweet Spot** 🍬 | Long near green box, cut below latest LL, reward toward prior LHs. |
---
🎯 Levels on My Radar
1. $5.00‑5.20 – “Do‑not‑break” support ⚔️
2. $6.00‑6.50 – First speed‑bump zone 🛑
3. $7.50‑8.00 – “Break the 3 tops” 🚪➡️ *Door to trend shift*
---
🛠️ Trade Idea (NFA, DYOR)
Scale‑in: nibble inside the green demand band 🍣
Stop‑out: just under the last LL – keep it tight ✂️
Take‑profit: peel some at **\$6s**, leave a moon‑bag for \$7.5‑8 🌖
---
⚡ Why I Care
APT’s been the kid in the back row while other alts moon. If that stacked high cluster cracks, short fuel + fresh eyeballs could send it sprinting. 🏃♂️💨
---
💬 Want intraday alerts or lower‑TF setups? Drop a comment! Let’s see if this giant wakes up or keeps snoozing. 🛌🔔
Aptos (APT): Are We Ready To Bounce? | BullishAptos has a good chance for a reversal soon, where the price has had a proper correction currently, leading the price back closer to EMAs, which could be considered a good buying area.
Now we set 2 areas or 2 trades (call it however you want), where one is opening from the current market price, which would mean a lower leverage position with multiple entries.
And the second trade option is on upper zones, where we will be looking for a BOS, so choose for yourself which way you want to go, either a safer trade and more day trading or scalping on upper zones. Both trades are with a good R:R ratio.
Swallow Academy

APT - APTOS Coin - Swing Long Idea📌 Fundamental Sentiment:
The entire crypto market is rallying, alongside other risk assets. This momentum is largely driven by U.S. policy expectations — specifically, Trump’s increasing pressure on Powell to resign and aggressively push for rate cuts from the Federal Reserve.
📌 Technical Analysis:
Price is currently testing the HTF supply zone with strong momentum. Additionally, it’s approaching a long-term bearish trendline that has dictated the downtrend since February 2025.
📌 Gameplan:
I want to see:
A clean breakout above the HTF supply zone with daily candle closure.
A confirmed break and close above the HTF bearish trendline on the daily timeframe.
If both confirmations align, I’ll start preparing for swing long setups, potentially riding into the early stages of a 2025 altseason.
—
🔔 Like & Follow for more daily updates. Feel free to drop your thoughts in the comments!
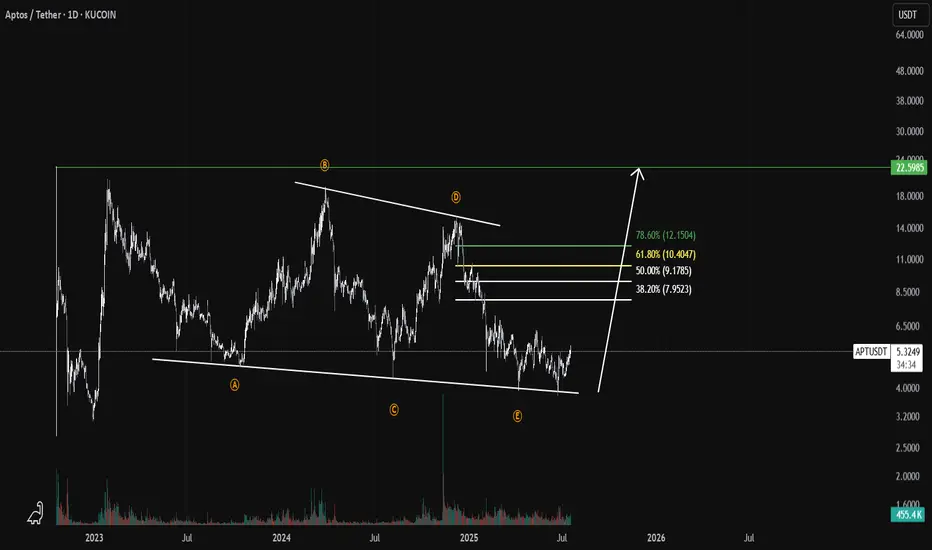
APT/USDT – Potential Breakout APT has been consolidating inside a clear ABCDE descending wedge (ending diagonal), a structure that typically signals a trend reversal. With wave E now completed, the price has started to push up from key long-term support.
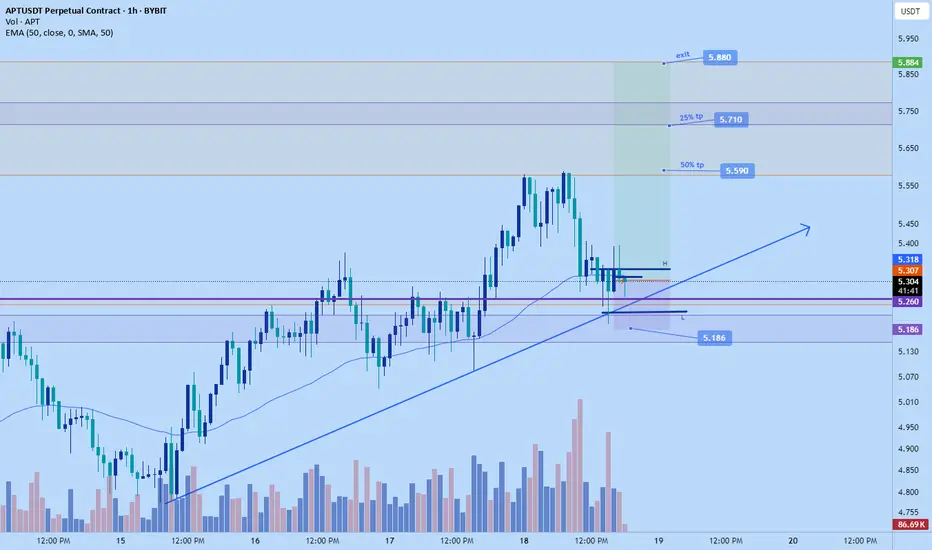
Aptos long to $5.880Aptos long
Sl: $5.186
Tp1: $5.59---50%
Tp2: $5.71---25%
Exit: $5.880
StrategY: DTT (Direction, Target ,Timing)
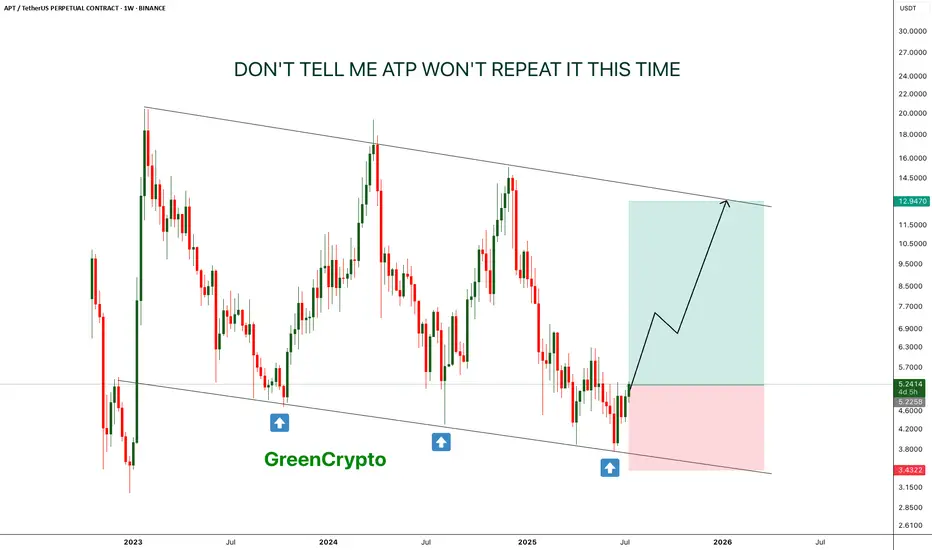
APT - Don't tell me this pattern won't repeat- This time is the charm, APT is is reversing from lower low on weekly chart.
- just like last two time, it is expect to forma new HL.
- there is a high chance that previous two patterns will repeat again
Entry Price: 5.22
Stop Loss: 3.4
TP1: 6.6632
TP2: 8.5059
TP3: 12.6945
Max Leverage: 5x
Don't forget to keep stoploss
Cheers
GreenCrypto
$APT Can still go to $10Based on the weekly timeframe, we are at the bottom or support where the price is respected its support.
Confirmation:
Macd cross
$APT could still rebound to $10.AMEX:APT could still rebound to $10 if it repeats its previous price action. History doesn’t repeat, but it often rhymes.
Disclaimer: This is not financial advice. Always do your own research before investing.

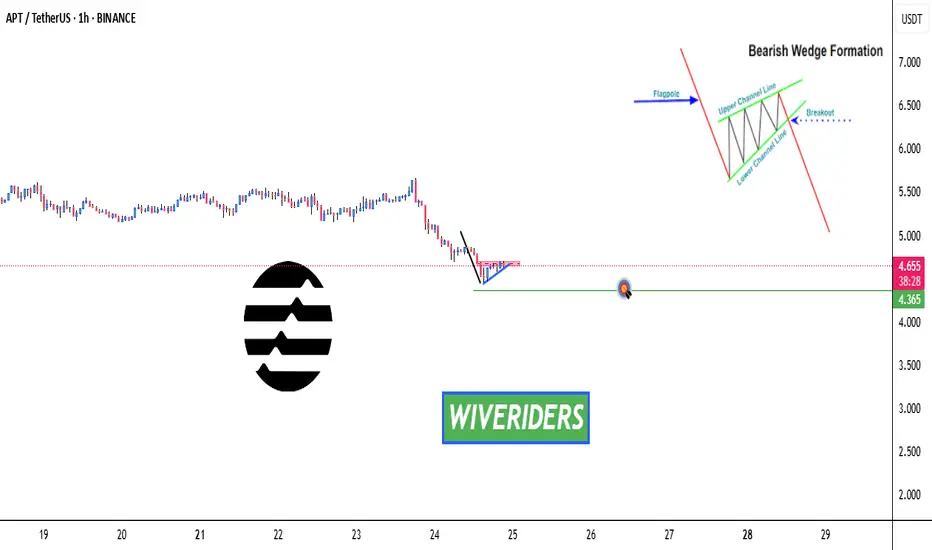
APT Forming Bearish Wedge Pattern – Watch the Support! APT Forming Bearish Wedge Pattern – Watch the Support! ⚠️📉
APT is forming a bearish wedge pattern and is now testing the blue support trendline.
🔻 If the support breaks, we could see a move down to the first green line level.
📊 Stay alert — this setup could trigger soon. Wait for confirmation before reacting.
APTUSDT Aptos Scalp buy / Long Setupaptos trying to breakout, wait till London session, if tp hits first then ignore, will share setup, must use sl as it's a scalp trade.

APTOS LONG- Price at the bottom, only one way UP
- BTC.D , STABLECOIN.D , OTHERS.D , OTHERS MC crypto atmosphere is green
- Good RR
- BUY current price or wait as picture.

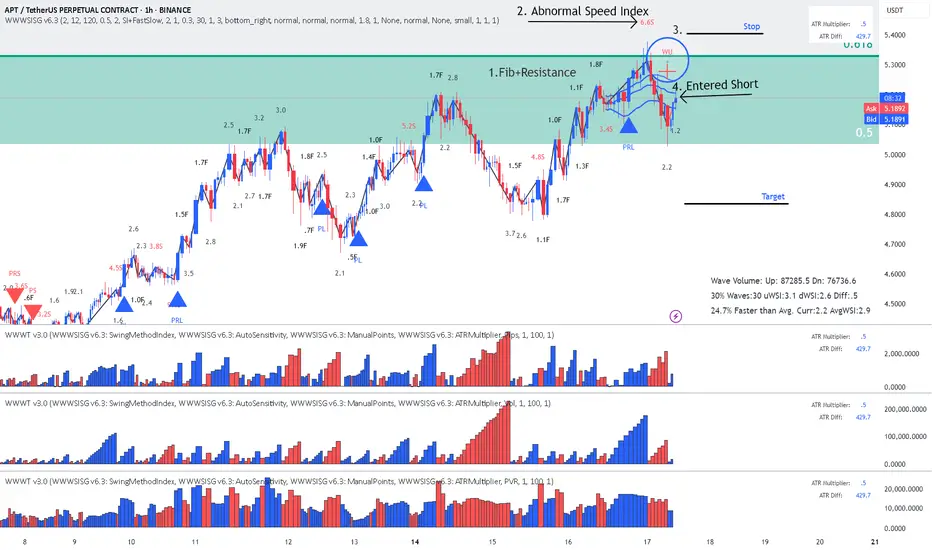
APT - Short on Wyckoff Up-ThrustReading the chart (annotations in sync with the chart):
1. Location: Fib+ Resistance level
2. Abnormal Speed Index of 6.6S (Hard to move up or closing positions)
3. Wyckoff Up-Thrust signal from signal
4. Entered Short on pullback to AVWAP
RR 1:2
Aptos Holds Range Low — Is a 300% Rally Toward $19 Now in Play?Aptos is trading at range lows, forming a potential bottoming structure near the value area low. If confirmed, a full range rotation could drive price up 300% toward the $19 resistance.
Aptos (APT) is currently trading at the range low of its long-term high time frame structure, showing early signs of a potential bottoming pattern. After an extended correction, price has found support near the value area low, a historically significant level where previous reversals have occurred. With the broader structure still intact, a confirmed bottom here could initiate a strong bullish rotation toward the range high — setting up a potential 300% move back to the $19 resistance zone.
Key Technical Points:
- Value Area Low Holding: Price is respecting range base and showing signs of accumulation
-Next Level to Reclaim: Point of Control (POC): Mid-range resistance and major inflection zone
- Upside Target at $19: High time frame resistance and previous reversal zone
The current price action on Aptos suggests that the market may be entering a bottoming phase. The value area low is being tested and respected, marking the third significant interaction with this level. Each time Aptos has reached this area in the past, it has triggered a rally — and the current structure appears to be repeating that pattern.
What’s different this time is the growing evidence of accumulation, with price consolidating tightly at support and showing reduced downside momentum. This forms the foundation of a bottoming setup, where price compresses near support before initiating an expansion move higher.
The immediate technical hurdle is the point of control (POC) — the most heavily traded price level within the current range. This mid-range level will act as a gatekeeper; once Aptos reclaims it, the probability of a full rotation to the range high increases dramatically. Traders should watch for strong volume and clean candle closures above the POC for confirmation.
The ultimate upside target lies near $19, a key high time frame resistance level. This area has previously triggered reversals and represents the top of the range. If price moves from the current range low to this high, it would mark a 300% gain, making the current zone a high-reward area for accumulation — provided structural support holds.
As long as Aptos holds the value area low, a rotation toward the POC and eventually the $19 resistance remains likely. A breakout above mid-range will confirm the bullish reversal and open the path to a 300% move.

APT/USDT undervalue !!APT is currently an undervalued project, consolidating in a tight range for over 150 days, signaling significant accumulation. The price is sitting below a key liquidity zone, which has historically acted as a launchpad for major moves. This extended sideways movement hints at suppressed volatility, often preceding explosive breakouts.

Aptos $45 Target Mapped, Ready To Boom! (PP: 867%)A market bottom leads to a bullish wave. Back in late 2022 Aptos (APTUSDT) produced a small market bottom and this led to a small bullish wave. This bottom lasted only one month in the making.
"Small" but this wave was more than 560% strong. Some 20 years holding a conventional index fund all happened here within 28 days. Cryptocurrency, it is certainly different compared to dinasourian investment products.
Present day the market bottom is a big one, it has been going for five months. This in exchange will lead to a very strong bullish wave, 3-5 times bigger than the previous one because the bottom is 3-5 times wider.
We have mainly two targets on the chart. These are easy targets and the market can definitely move higher in late 2025.
The first target is $22.5 for a nice 376%. The second target stands at $34 for a massive 620%. You can aim higher of course and if you do, you aren't likely to miss because the all-time high is $100 set on day one.
After these two targets we have $45 and this one is also mapped on the chart. 867% profits potential. You can scroll up to find it.
Remember to do your own planning. We tend to sell portions at each target on the way up. If in doubt, you don't have to be 100% right. You can sell 5%, 10% and then continue to hold. If prices rise too much and you feel uncertain, "should I hold or should I sell?" You don't have to be 100% right, again. You can sell tiny bits and you continue this process through the entire bullish wave. There are other ways to approach the market, buy and hold long-term. When prices are really high, close the position and move on.
Make sure to be you, do you and do great.
Thanks a lot for your continued support.
Namaste.
