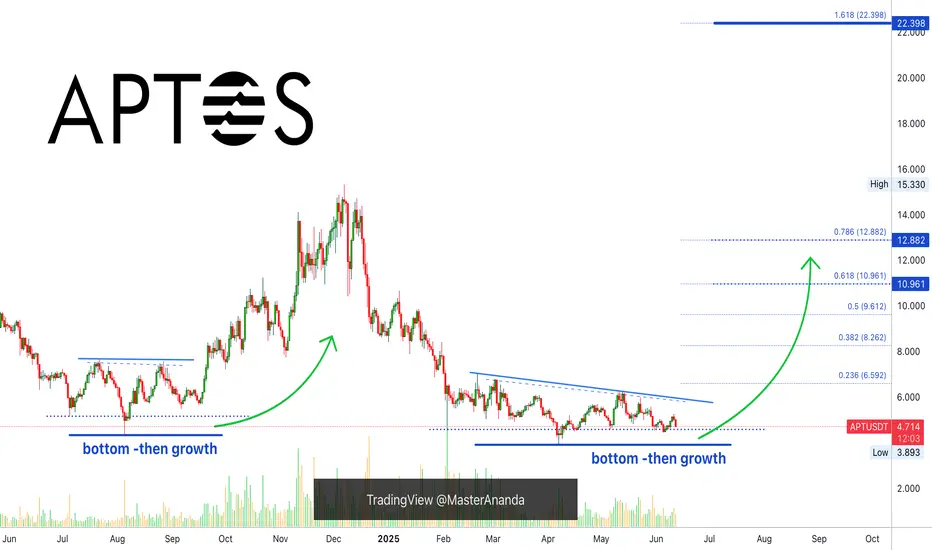
APT/USDT — Same Pattern, Same Potential?APT/USDT is showing a repeating cyclical structure — three times price has broken out of a falling wedge, each followed by a sharp rally.
📈 Historically:
▪️ Each breakout led to +150% or more gains
▪️ We’re now seeing a third similar setup forming
▪️ Targets (based on previous expansions): 8.18 / 14.44 / 31.138
📉 What if price dips again?
▪️ A pullback toward the lower boundary of the outer channel wouldn't be bearish
▪️ Structurally, it may align with the ongoing accumulation zone
⚠️ Reminder:
Even in a bullish setup, stop-loss sweeps and fakeouts are common, especially in uncertain market conditions.
Be adaptive — the structure matters more than the noise.
APTUSDT trade ideas

Live tradehello friends👋
✅️Considering the drop we had, now the price has reached an important and good support and the price is supported by the buyers, and the downward trend line has broken and the ceiling has been raised. Considering this, we entered into the transaction with capital and risk management.
🔥Join us for more signals🔥
*Trade safely with us*

APT at Historic Support – Massive Reversal Incoming?APTUSDT technical analysis update
APT has been trading inside a descending channel for over 900 days, and it's now once again testing the channel support. As shown in the chart, the price has bounced multiple times from this level, making it a historically strong support zone.
Currently, the target is the upper boundary of the channel (resistance). If APT manages to break out of this long-term descending channel, it could trigger a strong bullish move, possibly a moonshot.

Aptos APT price analysis💰 We will soon find out whether the price of #APT has finally begun to recover, or whether this is just a rebound before a further decline.
📈 For growth to continue, it is important that buyers manage to keep the price of OKX:APTUSDT above $4
◆ Next, the price will exit the falling channel and move towards the strong mirror level of $8
◆ And only after the #APTOS price consolidates above this level will it be possible to talk about an ambitious uptrend.
🐻 Well, the negative scenario is a lackluster fall from $4 to $3, or maybe even lower...
_____________________
Did you like our analysis? Leave a comment, like, and follow to get more

#APT/USDT#APT
The price is moving within a descending channel on the 1-hour frame and is expected to break and continue upward.
We have a trend to stabilize above the 100 moving average once again.
We have a downtrend on the RSI indicator that supports the upward move with a breakout.
We have a support area at the lower boundary of the channel at 3.81, acting as strong support from which the price can rebound.
Entry price: 4.03
First target: 4.16
Second target: 4.30
Third target: 4.59

APT at 4.78 $ Historic Support – Massive Reversal Incoming?#APT
The price is moving within a descending channel on the 1-hour frame and is expected to break and continue upward.
We have a trend to stabilize above the 100 moving average once again.
We have a downtrend on the RSI indicator that supports the upward break.
We have a support area at the lower boundary of the channel at 4.78, acting as strong support from which the price can rebound.
We have a major support area in green that pushed the price higher at 4.60.
Entry price: 4.88
First target: 5.047
Second target: 5.19
Third target: 5.35
To manage risk, don't forget stop loss and capital management.
When you reach the first target, save some profits and then change your stop order to an entry order.
For inquiries, please comment.
Thank you.

APTUSDT UPDATE
Pattern: Falling Wedge Breakout
Current Price: \$4.755
Target Price: \$8.00
Target % Gain: 65.19%
Technical Analysis: APT has broken out of a falling wedge pattern on the 1D chart, showing bullish momentum. Breakout is confirmed with a strong green candle and minor volume uptick. Close above resistance line indicates potential upside.
Time Frame: 1D

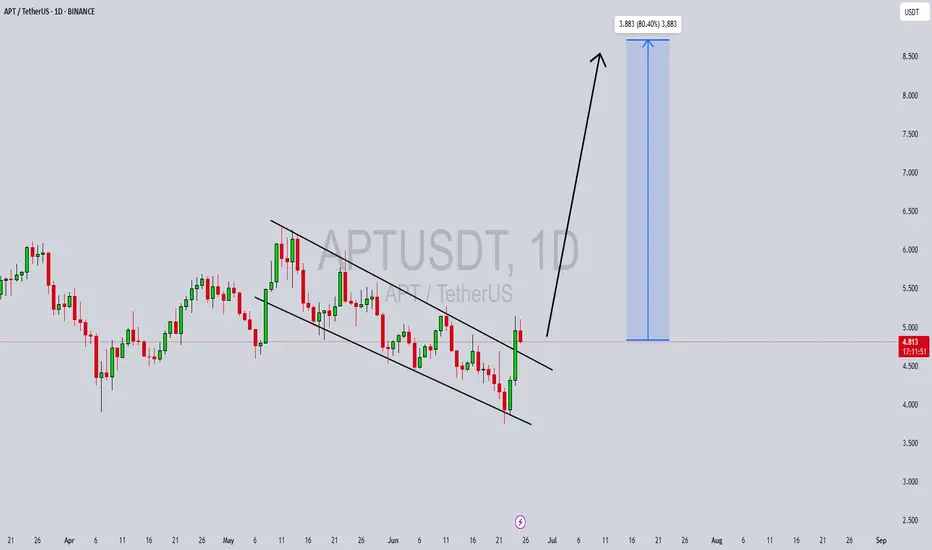
APTUSDT Forming Bullish Falling ChannelAPTUSDT is currently forming a bullish falling channel breakout, which is a classic reversal pattern indicating that the downtrend may be ending. The price action shows clear signs of compression within a downward-sloping channel, with the recent breakout suggesting a strong shift in momentum from bearish to bullish. With volume confirmation accompanying the breakout, this could signal the beginning of a powerful upside rally.
The breakout target projects a potential gain of 70% to 80%+, based on the measured move from the channel’s width. Such bullish setups are especially powerful when paired with increasing investor interest, which APT is currently experiencing. The broader crypto market sentiment is also tilting bullish, giving additional fuel to this breakout scenario. Traders and investors alike are watching APT closely as it reclaims key resistance zones and sets up for potential continuation moves.
Technical indicators such as RSI and MACD are aligning with the breakout, suggesting further strength could be ahead. The price structure also shows reduced selling pressure and more aggressive buying on dips, which supports the thesis of a medium-term rally. If APTUSDT continues to close daily candles above the channel resistance, a sustained rally to the $8–9 zone could be achievable in the coming weeks.
APT is also gaining traction within the crypto community and DeFi space, helping reinforce its long-term potential. With solid technicals and growing market engagement, APTUSDT is one of the stronger altcoin setups currently available for traders seeking breakout opportunities.
✅ Show your support by hitting the like button and
✅ Leaving a comment below! (What is You opinion about this Coin)
Your feedback and engagement keep me inspired to share more insightful market analysis with you!
Aptos Bullish, Altcoins BullishThe best is yet to come. Do not despair my dear friend, patience is key.
Aptos is breaking bullish right now after a final low with the highest volume since February. This confirms the latest double-bottom as the market bottom.
The high bullish momentum developing on today's candle, full green, coupled with the fact that a major flush is present on the chart reveals really good news. Today, things might seen down and quiet; everything can change in a day.
The bullish wave is on, it is starting now and it will be strong. Bottom prices will be gone within hours but we will experience long-term growth. Keep in mind that 100%-200% can happen within a matter of days. This is because the market is set to grow in excess of 1,000-2,000%, so the first jump is very strong but only signals the start. Getting bottom prices can be life changing.
This is a friendly reminder; the best is yet to come.
Aptos bullish means the altcoins are bullish.
The altcoins going bullish means that Bitcoin will soon resume with new all-time highs and additional growth.
Trust crypto, trust the market, trust your plan. You will be rewarded long-term.
The time to buy is now. Profits are on their way. To you!
Namaste.

APT around a historical support DO or DIEAPT / USDT
Price dropped hard to retest the massive historical support again
This multi years support ( 3$-4$) zone always shows great buying pressures thats why it catch our attention!
This support also can play as DO or DIE borderline between bulls and bears
The buyers must defend this area otherwise it will die and make new lows
Keep an eye on it

APT/USDTKey Level Zone: 4.6666 - 4.7500
LMT v2.0 detected.
The setup looks promising—price previously trended upward with rising volume and momentum, then retested this zone cleanly. This presents an excellent reward-to-risk opportunity if momentum continues to align.
Introducing LMT (Levels & Momentum Trading)
- Over the past 3 years, I’ve refined my approach to focus more sharply on the single most important element in any trade: the KEY LEVEL.
- While HMT (High Momentum Trading) served me well—combining trend, momentum, volume, and structure across multiple timeframes—I realized that consistently identifying and respecting these critical price zones is what truly separates good trades from great ones.
- That insight led to the evolution of HMT into LMT – Levels & Momentum Trading.
Why the Change? (From HMT to LMT)
Switching from High Momentum Trading (HMT) to Levels & Momentum Trading (LMT) improves precision, risk control, and confidence by:
- Clearer Entries & Stops: Defined key levels make it easier to plan entries, stop-losses, and position sizing—no more guesswork.
- Better Signal Quality: Momentum is now always checked against a support or resistance zone—if it aligns, it's a stronger setup.
- Improved Reward-to-Risk: All trades are anchored to key levels, making it easier to calculate and manage risk effectively.
- Stronger Confidence: With clear invalidation points beyond key levels, it's easier to trust the plan and stay disciplined—even in tough markets.
Whenever I share a signal, it’s because:
- A high‐probability key level has been identified on a higher timeframe.
- Lower‐timeframe momentum, market structure and volume suggest continuation or reversal is imminent.
- The reward‐to‐risk (based on that key level) meets my criteria for a disciplined entry.
***Please note that conducting a comprehensive analysis on a single timeframe chart can be quite challenging and sometimes confusing. I appreciate your understanding of the effort involved.
Important Note: The Role of Key Levels
- Holding a key level zone: If price respects the key level zone, momentum often carries the trend in the expected direction. That’s when we look to enter, with stop-loss placed just beyond the zone with some buffer.
- Breaking a key level zone: A definitive break signals a potential stop‐out for trend traders. For reversal traders, it’s a cue to consider switching direction—price often retests broken zones as new support or resistance.
My Trading Rules (Unchanged)
Risk Management
- Maximum risk per trade: 2.5%
- Leverage: 5x
Exit Strategy / Profit Taking
- Sell at least 70% on the 3rd wave up (LTF Wave 5).
- Typically sell 50% during a high‐volume spike.
- Move stop‐loss to breakeven once the trade achieves a 1.5:1 R:R.
- Exit at breakeven if momentum fades or divergence appears.
The market is highly dynamic and constantly changing. LMT signals and target profit (TP) levels are based on the current price and movement, but market conditions can shift instantly, so it is crucial to remain adaptable and follow the market's movement.
If you find this signal/analysis meaningful, kindly like and share it.
Thank you for your support~
Sharing this with love!
From HMT to LMT: A Brief Version History
HM Signal :
Date: 17/08/2023
- Early concept identifying high momentum pullbacks within strong uptrends
- Triggered after a prior wave up with rising volume and momentum
- Focused on healthy retracements into support for optimal reward-to-risk setups
HMT v1.0:
Date: 18/10/2024
- Initial release of the High Momentum Trading framework
- Combined multi-timeframe trend, volume, and momentum analysis.
- Focused on identifying strong trending moves high momentum
HMT v2.0:
Date: 17/12/2024
- Major update to the Momentum indicator
- Reduced false signals from inaccurate momentum detection
- New screener with improved accuracy and fewer signals
HMT v3.0:
Date: 23/12/2024
- Added liquidity factor to enhance trend continuation
- Improved potential for momentum-based plays
- Increased winning probability by reducing entries during peaks
HMT v3.1:
Date: 31/12/2024
- Enhanced entry confirmation for improved reward-to-risk ratios
HMT v4.0:
Date: 05/01/2025
- Incorporated buying and selling pressure in lower timeframes to enhance the probability of trending moves while optimizing entry timing and scaling
HMT v4.1:
Date: 06/01/2025
- Enhanced take-profit (TP) target by incorporating market structure analysis
HMT v5 :
Date: 23/01/2025
- Refined wave analysis for trending conditions
- Incorporated lower timeframe (LTF) momentum to strengthen trend reliability
- Re-aligned and re-balanced entry conditions for improved accuracy
HMT v6 :
Date : 15/02/2025
- Integrated strong accumulation activity into in-depth wave analysis
HMT v7 :
Date : 20/03/2025
- Refined wave analysis along with accumulation and market sentiment
HMT v8 :
Date : 16/04/2025
- Fully restructured strategy logic
HMT v8.1 :
Date : 18/04/2025
- Refined Take Profit (TP) logic to be more conservative for improved win consistency
LMT v1.0 :
Date : 06/06/2025
- Rebranded to emphasize key levels + momentum as the core framework
LMT v2.0
Date: 11/06/2025

#APTUSDT | Bullish Breakout from Descending ChannelBINANCE:APTUSDT has broken out of a 3-month-long descending channel, indicating a shift in momentum and a potential bullish reversal.
Entry: $5.64 - $5.10
🎯 Targets:
• TP1 – $6.77
• TP2 – $8.40
• TP3 – $9.94 (final target)
Stop Loss: $4.48
📌 Notes:
• EMA resistance sits around $6.10 — a daily close above this would further confirm strength.
• Consider moving SL to entry once TP1 is reached.
• Setup offers strong R:R with clear invalidation.
Disclaimer: Not financial advice. Manage your risk.
#Crypto #APT #Altcoins #CryptoTrading #Breakout #TechnicalAnalysis #PriceAction #BullishSetup #TradingView #Bybit #ChartPattern #SwingTrade #AltcoinSeason #RiskManagement

APTUSDT 1W AnalysisAPT ~ 1W Analysis
#APT If you still have faith in this coin. This support can be considered to start buying back with a short-term target of at least 15%++

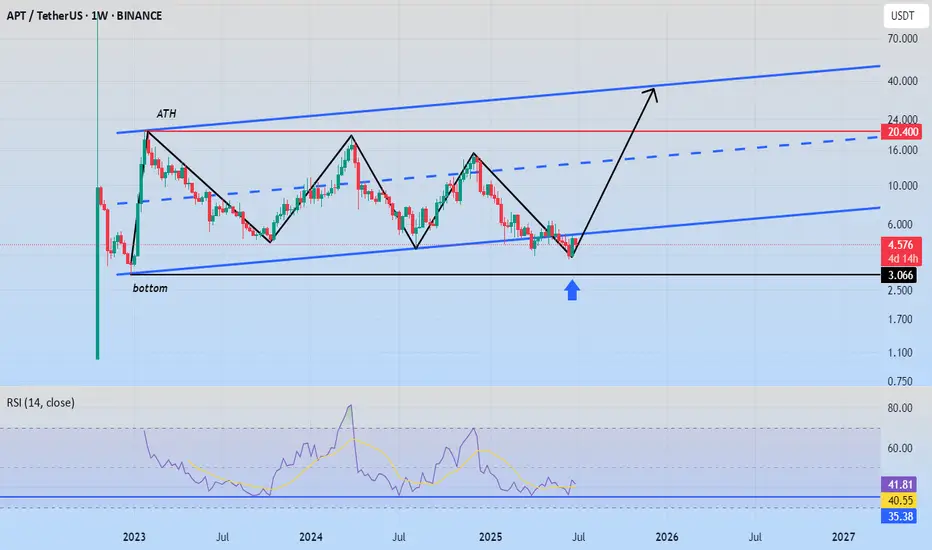
Aptos IdeaThe whole aptos chart is composed of corrective patterns and I do think we are now at the end of wave a and it might be a running flat where wave b is explosive towards upside exceeding start of wave a i have marked the level where we might end the wave b @ 1.618 targeting ATH around 22$ the wave B tends to be very fast so be positioned before
tp ATH Sl can be the 3.89$ very good setup 23RR

APT Accumulation pt.2After APT yesterday finally grabbed the extreme liquidity while creating a model 2 inside a model 2, i will now look for a valid entry, after missing the perfect one on the BOS down in the smaller model 2, up to the technical target. (A BOS above 4.9$ would be nice for more confirmation)

APT 35$ SOONHI GUYS
See the masterpiece on the chart.
Coinciding with very positive news for the currency,
The currency has been moving within a price channel since its launch.
We also see a false break of the channel, while maintaining the bottom on the RSI.
There was no break, so it's considered a false break.
With any chance of a market recovery, we'll find the currency rising strongly.
It will be a star in the Bull Run.
I wish everyone abundant profits.
Like and follow for more.
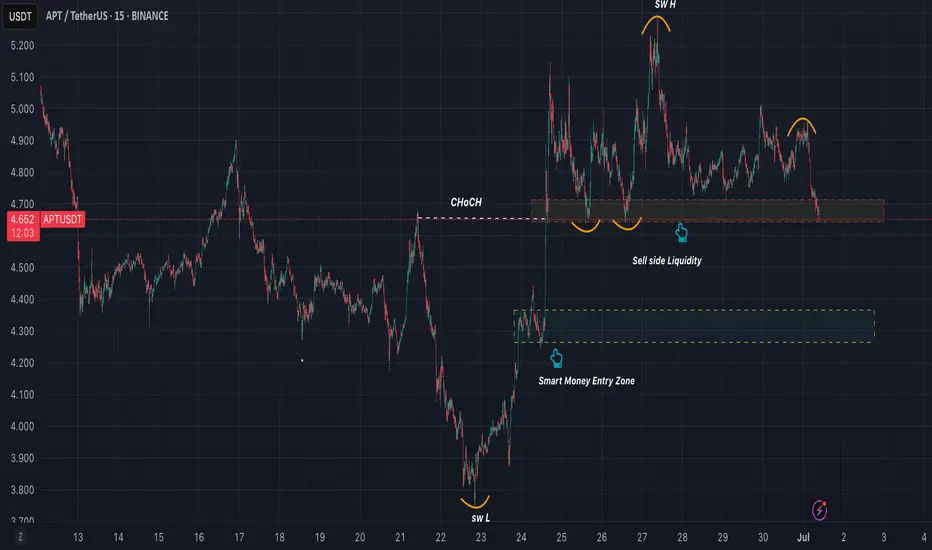
APTUSDT Price is testing around key support at $4.65. I believe it will likely break below this level to grab liquidity and trigger STL, then drop into the smart money entry zone between $4.26 and $4.36 . A strong reaction from that zone is expected. BINANCE:APTUSDT
wait for $5.30 otherwise sell to $4If the price can close above $5.30, you can consider buying on the pullback for $6 maximum not higher.
Otherwise, the price will react to $5 and you can consider selling to the $4.
Never consider buying on a downtrend.

Aptos (APT): Signs of Weakness | Important Zone at $5.55Aptos coin is showing some signs of weakness, where we are aiming to see the price fall near the $5.55 area. Once we fall there, we will be looking for 2 possible moves: for a bullish outcome, we would see a proper BOS form, and for sell-side movement, we need to see the breakdown + successful retest of the broken zone.
So for now we are waiting for further movement to lower zones, towards our neckline area (support).
Swallow Academy

APTUSDTEXPECTING Bearish Trend will start
SellStop and SL are mention on the chart
Note: Please move your SL to EP after TP1
Possibility is price will make H&S

Aptos (APT): Buyers Need To Establish Support ZoneAPT is near a local support area where we will be looking now for some sort of upward bounce from here. We might see a smaller move to lower zones (towards the liquidity line below).
Now, as long as we are between those zones, we wait but overall, what we want to see is break of structure and proper upward movement towards 100 EMA.
Swallow Academy

Aptos, Good & Bad (Leveraged Trading vs Spot)This is both good and bad at the same time.
The bad part, or rather sad part, is the fact that there hasn't been any decent bullish action recently. This pair did not grow by any significant amount after its 7-April low.
Ok, what about the good part?
The good part is that prices are low. This pair is "yet to move."
Low prices means a great buy opportunity for what we know comes next.
I know, I know... You might not believe me or your morale might be done but we already had a preview with many pairs growing between 100 and 300%. In less than two months. That's the preview. But the market is big and not the entire market can advance in a single wave. That's why I keep on harping "choose wisely," because sometimes we can end up with the pairs that are not moving in the current wave. They will move, trust, but some will move now and others later down the road.
Ok, good and bad.
The bad part is not that bad but it can be said that it is bad that prices are low. But this is actually good. If prices were high, there would be no buying opportunity, we would have to ignore, dismiss this pair. Since prices are trading low-near support, we can accumulate; buy and hold focused on the long-term.
I mentioned tons of times leveraged trading but all these chart setup can be traded spot. In fact, any setup that is good for leverage is even better for spot because the risk is none.
With spot trading we simply hold. What's the problem? You expected 1,000% growth in 2 months? If that's the case, it simply takes longer and we wait. See? No loss, the worst case scenario is a long-term wait. That's spot trading, buy and hold and you will win in the end.
Leveraged trading is more complex but you know, risk vs reward. You put on lots of risk, huge risk but wow, the rewards potential is awesome. We only approach this tool when we learn the market, when we know what we are doing and we have no need for money; only when money is already plentiful and available.
If you have a need to earn now, "make money fast," and so on; avoid leveraged trading at all costs because it is very likely that you will lose everything rather than achieve success. But, on the other hand, if you are living the good life, you communicate with your wife and you have heart, you are grateful for the food you eat, for the simple stuff, for your house, your friends, your bed; then you can use leveraged trading. Because you will be able to know when to close a position and say "thank you!" rather than double-down on a losing trade.
In short, we need a stable life and mind to use this tool with any success. If our lives and minds are not stable, it is better to start slow. If you cannot make money slow, you will not be able to make money fast. If you cannot appreciate $100, you won't be able to accept $1,000 for a single trade.
So, thanks a lot for your continued support.
I hope you are enjoying the content. It is always my pleasure to write for you, day after day after day.
Remember, it is not about getting it right or getting it wrong, it is all about a mental, emotional and spiritual connection. I am sharing what I learn just so that you can avoid the pain of a major loss, something that I know just too well because I've been there before. I've lost everything countless times and yet, I continue to fight, prosper and grow.
Namaste.
APT/USDT: Bullish Technical OutlookAPT/USDT: Bullish Technical Outlook
APT has completed a broader and well-defined bullish pattern, suggesting an upward trajectory in the coming days and possibly weeks. The continuation of this move will largely depend on market volume.
Under normal conditions, I'm anticipating a price move toward the $5.50–$6.00 range. If momentum remains strong and sentiment aligns, an extended push toward $6.80 could also be in play.
However, the current geopolitical tensions in the Middle East—particularly involving Trump—introduce an element of uncertainty. It remains unclear how these developments might ripple through the crypto market, but such instability could influence sentiment and short-term volatility.
You may find more details in the chart!
Thank you and Good Luck!
❤️PS: Please support with a like or comment if you find this analysis useful for your trading day❤️
