APTUSDT.PAPTUSDT.P is in bearish trend.
Potentially printing LH and LL.
Sellers are strongly active.
We sell at CMP.
APTUSDT trade ideas


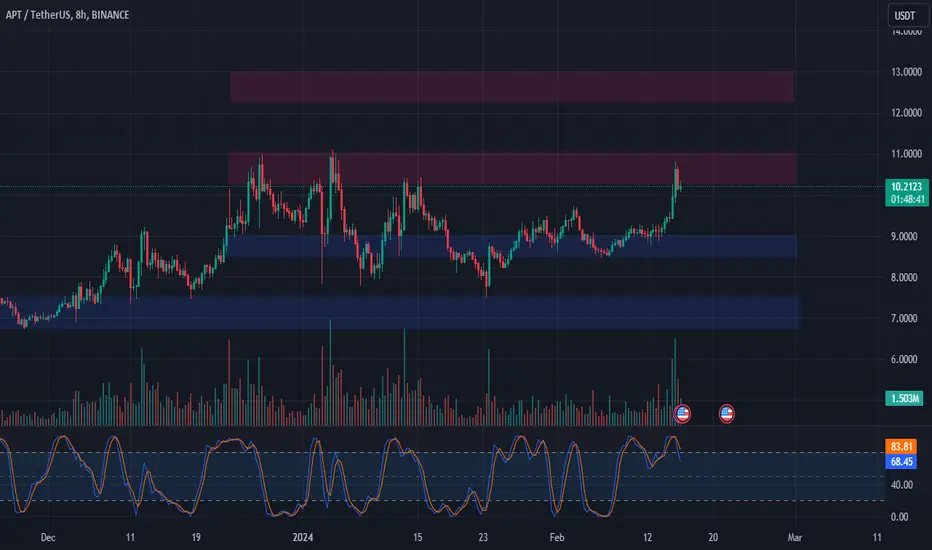
📈🛍️ APT Trade Analysis - Testing Resistance! 🚀💹📊 Technical Overview:
APT: Testing resistance at $10.30 - $11.00.
Key Levels: $10.30, $11.00, $9.00, $12.30, $13.00.
📉📈 Trade Analysis:
Resistance Test: APT testing the resistance area.
Overbought: Overbought on the 8-hour chart.
Support Levels: Potential support at $9.00.
Long Trade Plan: Consider entering a long trade if $9.00 holds.
Profit Targets: $10.30 - $11.00, $12.30 - $13.00.
Potential Gain: Roughly a 45% gain from $9.00 to $13.00.
Stop Loss: Below $8.50.
🚀🔄 Note: Monitor price action around $9.00 and adjust trade strategy accordingly. 📊💡 #APT #TradeAnalysis #StockMarket 📈📉

LONG #APTUSDT from $9.3LONG #APTUSDT from $9.326
1h TF. The instrument has formed a symmetrical triangle pattern, and the buyer's activity has increased over the past few days. Volumes have increased (DV - 142mn). An additional factor for the upward movement is the resistance level of several approaches, which is followed by stop losses of short participants. I expect a proto-trading and long-term movement to the upper resistance levels with the support of buyers' volumes in the glass of orders.

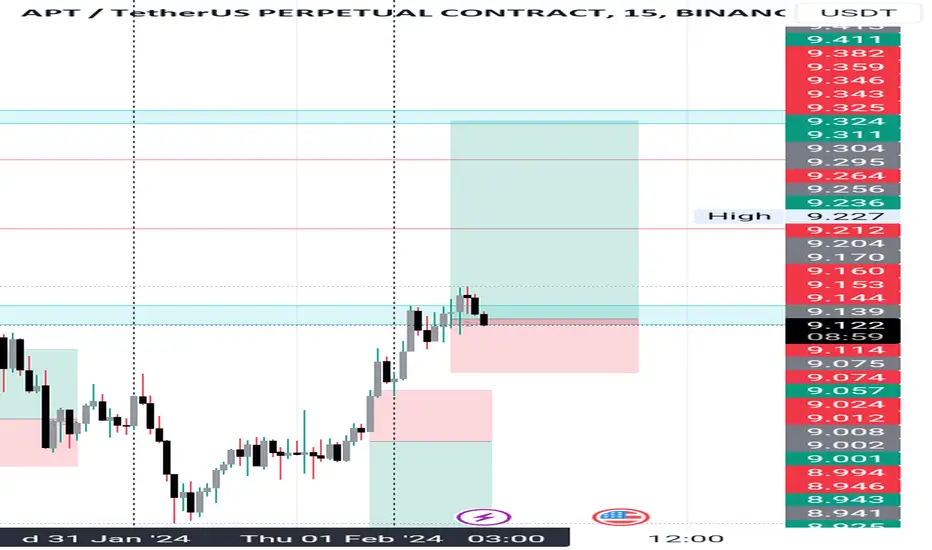
Apt outlookThe price has broken out from resistance, displaying bullish momentum. I will set my take profit at the green box.


Apt short🍰
I anticipate that apt will test the demand zone a couple of times before making a significant move. I plan to short it from this point and take profits along the way.

APT Possible Long Opportunity APT Possible Long Opportunity.
Waiting for breakout of trendline.
Waiting for breakout of residence zone.
After Retest will Enter Long

APT APT is being rejected on the demand zone, indicating strength. I will exit for profit at the major resistance level.

APT (4h) is ready to breakout of triangleAPT (4h) is ready to breakout of triangle.
Target price 12,2$ (+33%)

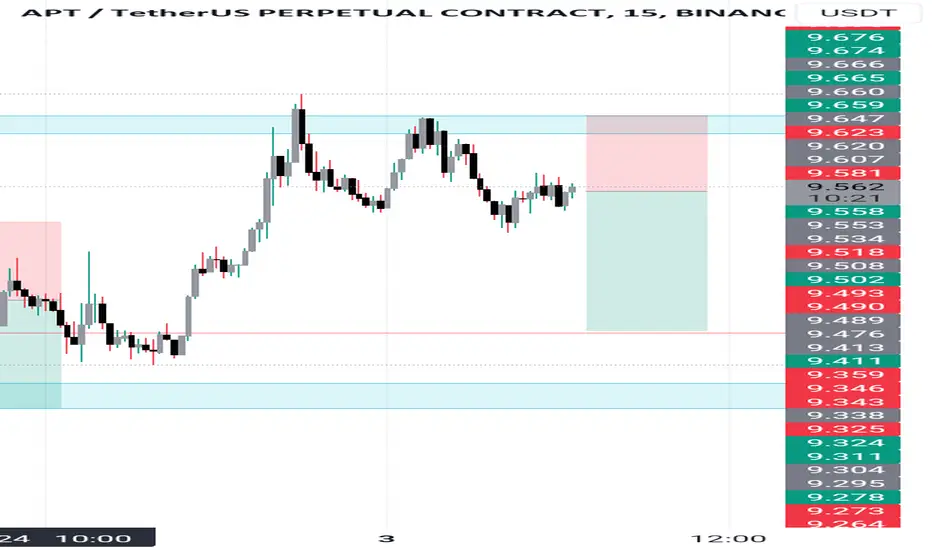
Apt 💡
I plan to scalp at this price level by shorting and taking partial profits as the price drops.

Apt scalping
I am currently engaged in lower time frame scalping trades. The trade is holding the trendline well, and I anticipate a minor price decrease from this level. I plan to take my profits at a major support level


APTUSDT.P Aggressive Trend Trade 1RAggressive Trend Trade 1R
- short impulse
+ volumed T1
+ support level
+ volumed 2Sp-
+ weak test
+ first bullish bar closed similar level entry
Calculated affordable stop loss
Take profit under volumed level
Daily context
+ long balance
+ 1/2 correction
- expanding ICE
+ support level
+ volumed manipulation

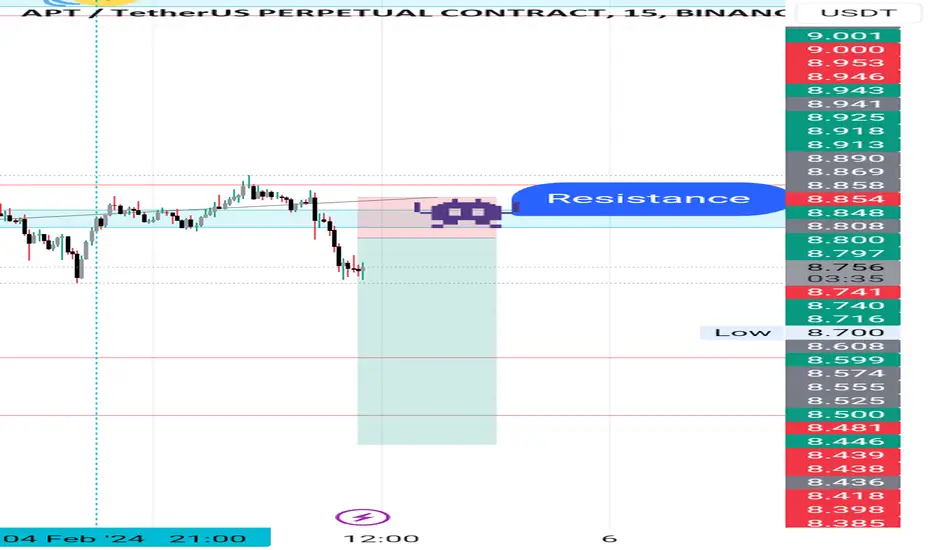
Apt retracement It's possible that the price will revisit and test the resistance zone. Keep an eye out for it.

Apt ideaIn the crypto market, it is crucial to adopt a mindset focused on trading based on the current market conditions rather than attempting to predict its movements. This approach aligns with your best interest
Instead of relying on predictions, it is advisable to switch from long positions to short positions when appropriate. This allows for flexibility and the ability to capitalize on potential market downturns. By doing so, one can anticipate the price to decrease significantly or take profits when specific price levels, indicated by the user's vertical red lines, are reached.
Following these recommendations can help traders navigate the crypto market with a more informed and adaptable approach.

Apt bullish🔥 Based on the movement of Apt on the upside trendline on a 1-hour time frame, it appears to be extremely bullish, rejecting downward moves and showing upward movement. In my opinion, there is a strong potential for a pump in the near future.


Apt shortI have taken a short position because I believe there will be a retracement. It is a strategy to take profit at the 4-hour timeframe low. Additionally, you have the option to partially take profit at your own target.
APT Full send incoming Apt Looking so good to be sent straight.
Longed 9.3
Tight sl at 9.2
Targeting 11
Note: Not a Financial Advice.