AptI am currently lacking sufficient apt altcoin bias, as it appears that the price is declining. Consequently, I am strategically capitalizing on this situation by taking profits at various intervals during the decline.
APTUSDT trade ideas

Apt short termThe price is expected to retrace back to my take profit (tp). However, it's important to note that this trade is not considered long term.


#APT/USDT breaks the Diagonal Trendline in 4-Hour TF!#APT/USDT breaks the Diagonal Trendline in 4-Hour TF!
AMEX:APT is trying to hold PWH $9.345 as a support level. If #APTUSDT holds this level, we can expect some bullish momentum.
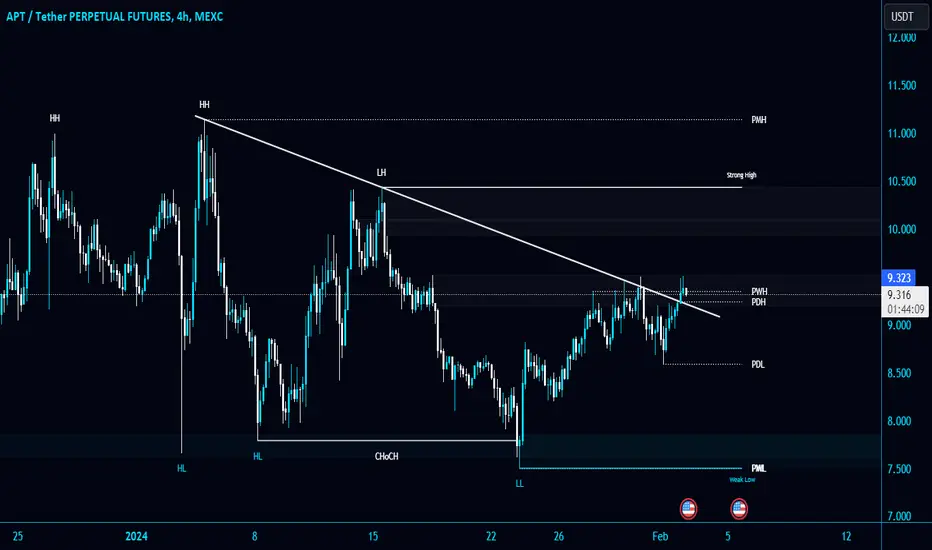
APT ANALYSIS (4H)From where we have inserted "Start" on the chart, a correction has been created, which looks like a diametric (or symmetrical) one.
We now seem to be in the G wave of this diametric. We expect to move from the specified supply side to the Demand side.
For risk management, please don't forget stop loss and capital management
When we reach the first target, save some profit and then change the stop to entry
Comment if you have any questions
Thank You

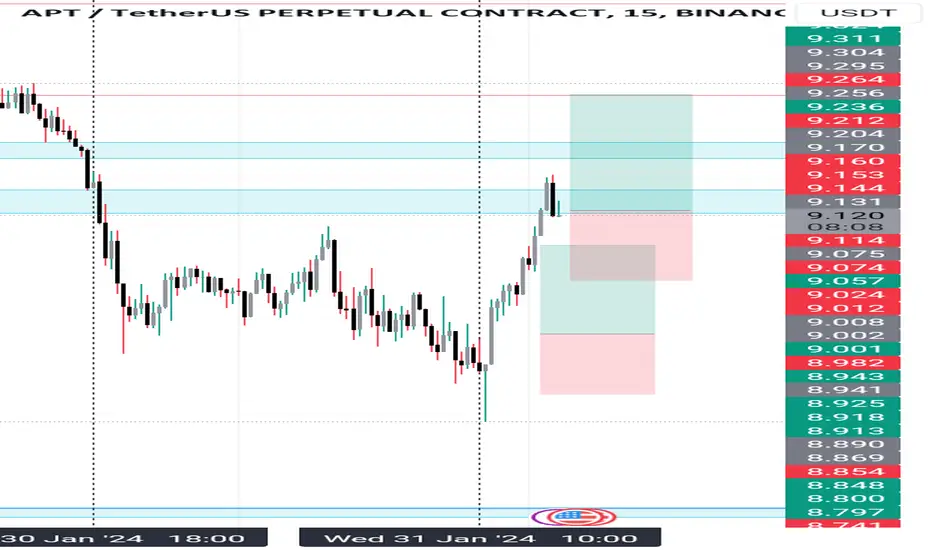
Aptos ideaThe market structure break on the 15-minute time frame indicates a potential strength for an upward move. As for my target profit zone, it is at 9.256.
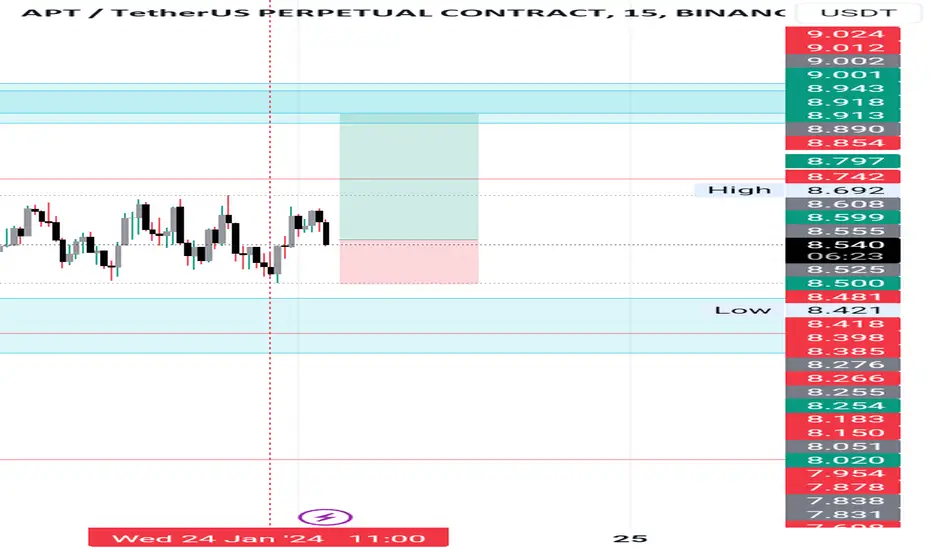
APT_USDT Trade IdeaExpecting our 1:3RR trade from here as well. After the SL hunt, the bos, then a retracement to entry should occur.


Nice Combo-APTAPT a Layer 1 based on MOVE. In the early days of its launch, it relied on airdrops and a star team to attract many people. However, in the process of this round of rise, the performance is inferior to that of SUI, which is also based on MOVE. In TVL's ranking, it fell to outside TOP20. APT is our protagonist today.
After reading the previous articles, you must be familiar with our indicators. You can see that the TSB indicator gave a SELL signal yesterday. This means APT is entering a bearish trend and you can open a short position. This is a independent perfect operation.
In addition to the TSB indicator, you can see that APT is falling with fluctuation, which meets the conditions of the KDMM indicator. On the daily KDMM indicator, the bullish momentum is gradually fading, which is consistent with the signal given by the TSB indicator.
And at the 4h level, the KDMM indicator is at a high level, and the bearish momentum is also significantly increasing.
This is a classic scenario of indicator coordination. While trend indicators are giving signals, momentum indicators are also changing. Of course, you can operate independently according to TSB. The purpose of introducing the KDMM indicator is to let you know what the situation is.
Introduction to indicators:
Trend Sentinel Barrier (TSB) is a trend indicator, using AI algorithm to calculate the cumulative trading volume of bulls and bears, identify trend direction and opportunities, and calculate short-term average cost in combination with changes of turnover ratio in multi-period trends, so as to grasp the profit from the trend more effectively without being cheated.
KDMM (KD Momentum Matrix) is not only a momentum indicator, but also a short-term indicator. It divides the movement of the candle into long and short term trends, as well as bullish and bearish momentum. It identifies the points where the bullish and bearish momentum increases and weakens, and effectively capture profits.
Disclaimer: Nothing in the script constitutes investment advice. The script objectively expounded the market situation and should not be construed as an offer to sell or an invitation to buy any cryptocurrencies.
Any decisions made based on the information contained in the script are your sole responsibility. Any investments made or to be made shall be with your independent analyses based on your financial situation and objectives.

apt InteligentAssetbullish scenario
resistances 10.12 ascending trend line,
10.44 pivot high,
10.8 upper limit channel,12.8
bearish scenario
supports 9.18, 8.7 in 50 ema, 7.8, 7.5 pivot low, 6.9


APT: Descending TriangleTrade setup : Trends are mixed. Price is consolidating in a Descending Triangle pattern. We wait for a breakout.
Pattern : Price is trading in a Descending Triangle pattern. Typically, a breakout will occur in the direction of the existing trend. Most traders will take a position once the price action breaks through the bottom line of the triangle with increased volume, which is when the price should decline an amount equivalent to the widest section of the triangle.
Trend : Neutral on Short- and Medium-Term basis and Uptrend on Long-Term basis.
Momentum is Mixed as MACD Line is above MACD Signal Line (Bullish) but RSI ~ 50 (Neutral).
Support and Resistance : Nearest Support Zone is $8.00 (previous resistance), then $5.40. The nearest Resistance Zone is $10.00, then $12.50.

APT - Aptos breaking a H&S patternAptos after a long period of consolidation, start to gaining momentum breaking up a 8$ resistance level. It appears to re-test the zone for a further bullish continuation.
A potential possibile target is 16$ but it can be far more then this, from the entity of the project. If a good trend persist towards 16$ we are going to maintain the positions.
Good trading

Apt shortI shortapt/usdt due to trendline breaks. My target profit zone is at 8.854. The market bias is currently neutral, but I will attempt to make a quick profit by trading.

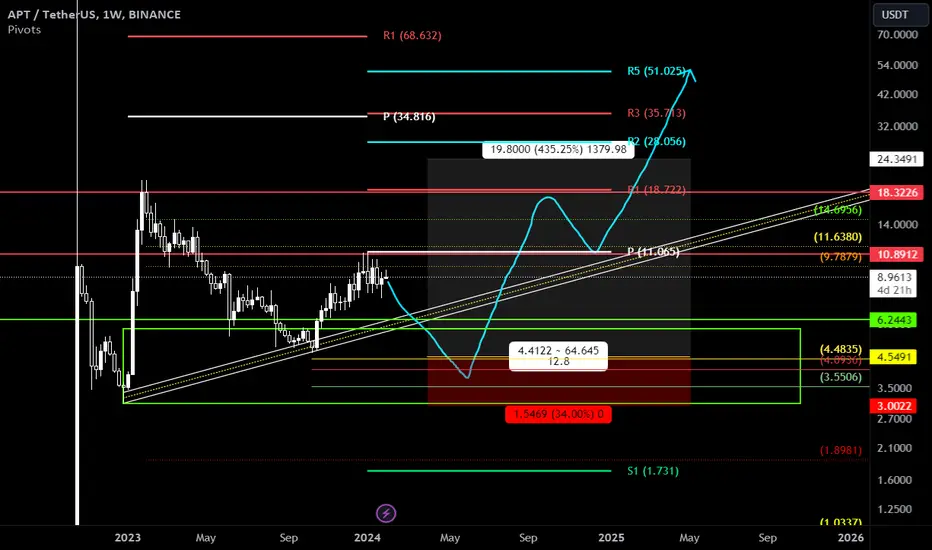
✴️ Aptos Year-Long Lower High (Going Down)Aptos (APTUSDT) produced a major bullish wave in early 2023, more than 560% growth.
After the peak we had a prolonged correction, 10 months and finally a new bullish jump.
This jump is the current move which is signaling the end based on the following signals:
➖ Trading daily below EMA10 and EMA21.
➖ RSI bearish divergence since Oct. '23.
➖ Low volume on the rise.
➖ Recent double-top + rounded top formation.
➖ We have a lower high January 2024 compared to January 2023.
Lower highs can lead to lower lowers; Not necessarily but the potential is there.
👉 This one is going down based on the chart structure and early signals but, things can always change.
Namaste.

Apt long 🔥 My profit take is set at a price of 8.890. I believe the price is looking bullish, which means it is showing signs of upward momentum and potential for further gains. This positive price movement gives me confidence in my profit target.

Apt longI'll enter the market when there is a long and bullish pullback opportunity. I will take my 70% off the position at the 8.742 zone.
APT is going bullish if this scenario happenedfirst thing we need to see move up and break the ressistance of 8.70 $ and we see the first higher high if that happened then apt is goin bollish, first target will be 10.17$
this is my analyse it's not a recomandation to buy or sell !!


