APT: Resistance BreakoutTrade setup : Price broke above $8.00 resistance to signal continuation of uptrend, with upside potential to $10.00.
Trend : Uptrend across all time horizons (Short- Medium- and Long-Term).
Momentum is Mixed as MACD Line is below MACD Signal Line (Bearish) but RSI > 55 (Bullish). MACD Histogram bars are rising, which suggests that momentum could be nearing another upswing.
Support and Resistance : Nearest Support Zone is $5.40 (previous resistance), then $4.70. The nearest Resistance Zone is $8.00, which it broke, then $10.00.
APTUSDT trade ideas


Correction PhaseOn day chart
Aptos is in #CorrectionWaveABC with Wave A is done at $7.47
Now, Wave B is doing then Wave C will be happened and I expect target of Wave C around $7 that level is chance to join
Wait and see

APT ANALYSIS (4H)It seeFrom where I entered START, an ascending pattern has started . ms that we are inside a large diametrical
For wave E, the green range is the range on which you can take risks and enter the buy/long position.
We enter the position only if it reaches the green range Stabilization of a daily candle below the range is our stop
For risk management, please don't forget stop loss and capital management
When we reach the first target, save some profit and then change the stop to entry
Comment if you have any questions
Thank You


APT: Approaching ResistanceTrade setup : Price broke above $8.00 resistance but failed to hold above it. However, it is still in an Uptrend. Now we wait for price to either 1) break back above $8.00 to signal continuation of uptrend, with upside potential to $10.00, or 2) pull back near $6.60 minor support (200-day MA) for a swing entry in Uptrend with upside potential back to $8.00.
Trend : Uptrend on Short- and Medium-Term basis and Neutral on Long-Term basis.
Momentum is Mixed as MACD Line is below MACD Signal Line (Bearish) but RSI ~ 50 (Neutral).
Support and Resistance : Nearest Support Zone is $5.40 (previous resistance), then $4.70. The nearest Resistance Zone is $8.00, then $10.00.

APT APTOS
On the weekly time frame we have a head and shoulders pattern where the price is pulling back to the neckline. The first targert is the yellow line
Also in the Bitcoin pair (APTBTC) we are in a accumulation zone at the bottom with good volume.
So the pump is near, the pump is here...

Short APT/USDT Potential SHORT term scalp APT/USDT.
last trade for the night. Kinda risky trade, but low nice gains if played out and low loss.
Recommend not trading above 5-10x leverage as you can gain a lot by doing small trades with tight stop loss. So im kinda just doing lots of trades out of my strategy. And learned that i gain so much more by doing this than going 100x leverage where you are doomed to be liquidated

APT: DECEMBER 16. 2023A pivotal level has been reclaimed and price has officially exited accumulation phase. IMO, this coin is primed to go parabolic at some point. I have bought a bag. I expect full thrust above 9.5.

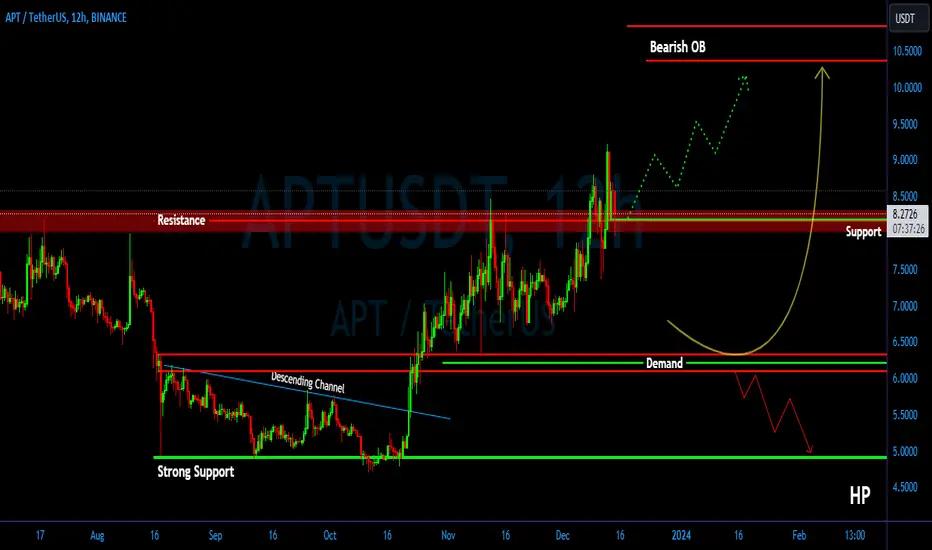
APT/USDT Retesting Phase is confirm. Ready Continue Upward ??💎 APT has been a major focal point in the market, currently in the midst of a retesting phase at a critical support area. If APT successfully bounces from this level, there's a strong probability of a significant upward movement, with the next target being our Bearish OB area.
💎 However, should APT fail to rebound from the support area, or worse, break below it, this could indicate a false breakout. Such a development would be a negative sign for APT's future trajectory, potentially steering it into a downward trend towards the demand area.
💎 In the demand zone, a robust recovery is crucial for APT. The asset needs to demonstrate a strong bounce back, aiming to reclaim the support and continue its upward momentum towards breaking out of the resistance area. If APT fails to show a positive response in this demand zone and breaks down further, it could signal a shift back to a bearish trend, potentially leading to further downward movement towards a more substantial support area.
APT: Bullish Pennant BreakoutTrade setup : Bullish breakout from Pennant pattern signals resumption of uptrend with upside potential to $10.00. Stop loss at $7.30. Previously, price broke above 200-day moving average, which confirmed a bullish trend reversal to an Uptrend.
Pattern : Bullish Pennant - forms typically following a sharp advance, followed by a brief triangular shaped consolidation in price (a small change in direction), before the previous uptrend (bullish) typically resumes. The period of consolidation should have lower volume and the breakouts should occur on higher volume.
Trend : Uptrend across all time horizons (Short- Medium- and Long-Term).
Momentum is Bullish (MACD Line is above MACD Signal Line and RSI is above 55).
Support and Resistance : Nearest Support Zone is $5.40 (previous resistance), then $4.70. The nearest Resistance Zone is $8.00, which it broke, then $10.00.

83% profitHello
I just talk about Spot trade not leverage trades and talented traders could analyze my chart for leverage trades.
83% for long position from this area.

APT - BEARISH SCENARIO
This chart is self explanatory and clearly, we have just completed wave 4 of an impulse considering wave 2 is fast and sharp we expect wave 4 to be extended and long according to Elliotwave theory which is what we got. Now we are in a journey down for wave 5 ($4.6-3.6)


💡Trade Idea #APT/USDT:#Aptos broke its resistance zone, bullish market structure. A possibility to move upwards.


#APT/USDT#APT
The price has been trading in a downtrend since February 2023
This downtrend has been broken and it is expected that the price will rise linked to Bitcoin's upward movement
And with Haddock there was a disengagement in the movement.
Entry areas specified on the drawing
About price 5 $
With a goal of 14 $
Nearly 300% expected rate of increase
On more than one expected upward wave

APT to 14?Yes, another H&S formed beautifully and we are witnessing it break. I will be taking profits at those green marks.

APT/USDT Looking Bullish
Entry Zone: 7.85$ to 7.50$
Targets:
TP1: 7.95$
TP2: 8.05$
TP3:. 8.25$
TP4: 8.35$
TP5: 8.45$
Stop Loss: 6.95$

APT: Bullish Pennant BreakoutTrade setup : Bullish breakout from Pennant pattern signals resumption of uptrend with upside potential to $8.00 or even $10.00. Stop loss at $6.60. Previously, price broke above 200-day moving average, which confirmed a bullish trend reversal to an Uptrend.
Pattern : Bullish Pennant - forms typically following a sharp advance, followed by a brief triangular shaped consolidation in price (a small change in direction), before the previous uptrend (bullish) typically resumes. The period of consolidation should have lower volume and the breakouts should occur on higher volume.
Trend : Uptrend across all time horizons (Short- Medium- and Long-Term).
Momentum is Bullish (MACD Line is above MACD Signal Line and RSI is above 55).
Support and Resistance : Nearest Support Zone is $5.40 (previous resistance), then $4.70. The nearest Resistance Zone is $8.00, then $10.00.

APT/USDTAMEX:APT inverse head and shoulders pattern on the 3D time frame I have measured the potential target, GL

APT |Aptos| Purchase zone from $ 7.2 and belowI buy a token from 7.2 and below
There will be a very strong level.
