APT: Bullish Pennant BreakoutTrade setup : Bullish breakout from Pennant pattern signals resumption of uptrend with upside potential to $8.00 or even $10.00. Stop loss at $6.60. Previously, price broke above 200-day moving average, which confirmed a bullish trend reversal to an Uptrend.
Pattern : Bullish Pennant - forms typically following a sharp advance, followed by a brief triangular shaped consolidation in price (a small change in direction), before the previous uptrend (bullish) typically resumes. The period of consolidation should have lower volume and the breakouts should occur on higher volume.
Trend : Uptrend across all time horizons (Short- Medium- and Long-Term).
Momentum is Mixed as MACD Line is below MACD Signal Line (Bearish) but RSI > 55 (Bullish). MACD Histogram bars are rising, which suggests that momentum could be nearing another upswing.
Support and Resistance : Nearest Support Zone is $5.40 (previous resistance), then $4.70. The nearest Resistance Zone is $8.00, then $10.00.
APTUSDT trade ideas


APTOS/USDT 1D. Cup forming. Phases. Target zones. Time zones.Here's hype Aptos blockchain chart.
When listed, dumped huge by about 71%. Similar as SUI for example now. After that - rocket pump for about 565%, showing "strength" of an instrument.
After that pump, huge cup started to form, which is shown in this idea.
1st phase of this pattern - is descending in the downtrend trend channel. You may also call it ABC correction.
After that, being in this channel - falling wedge started to form, which gave the beginning of the second phase of this big cup potentially(!). From the height price has corrected for about 85% of the impulse to the previously resistance of the local accumulation zone, which was also the first stop during the pump.
We're now being in the second phase of this cup, which is - accumulation. Right now potential horizontal channel is forming. It's worth noting, that this can last for a very long time, so you should notice that.
But, the plus is, that this asset is only the first cycle on market, so due to it, it might move very quickly(volatility), which can be used.
As for now, the price of the Aptos is breaking above the falling wedge and forming potential bull-flag(consolidation in the form of a triangle after an impulse). Hence - if the price breaks above this local triangle - the target zone will be the amount of the previous impulse which is about 82%. I have marked the potential targets zone on chart.
As a bonus, i have also pointed the approximate time zone of each next phase of a cup potentially:
1) 3d phase is rise towards the resistance of the cup, which is firstly 12$ zone, then - 20,4$ zone. This could happen somewhere in the spring 2024(april-june).
2) After that - next phase, which is the 4th one - breakout of cup and rise, which falls approximately on Fall 2024 in the date somewhere of october-november 2024(as altcoins local season right now).
As for now, the price is between 2 zones - support zone, which previously acted as the resistance, and the resistance local zone, which previously acted as support, this two zones form the channel, which the price is currently in right now.
Until we're walking in this channel - we might still see the move somewhere to the middle of the channel or even it's bottom part, to retest the broken falling wedge. Might even be the false breakout downwards if the market sees capitulation at the moment. Yet, it's likely to be bought out quite quickly. As to that matter, you might even use this period(somewhere about january-february potentially), if it will occurs, or just skip it and stay calm(don't react).
If price breaks the resistance - it might move to the next resistance zone, after which it's very likely to see the pullback(mention timezone above), after which rising to the resistance of the cup. In that case - very beautiful cup will be formed, which is very good for the manipulator(people will see that cup). After that, the price might see the movement to somewhere about 60-100$ zone approximately. Better make the update later with the clear targets. But those are the approximate milestones of this cup.
The volume is now seeing the compression, which can be observed on the volume indicator.

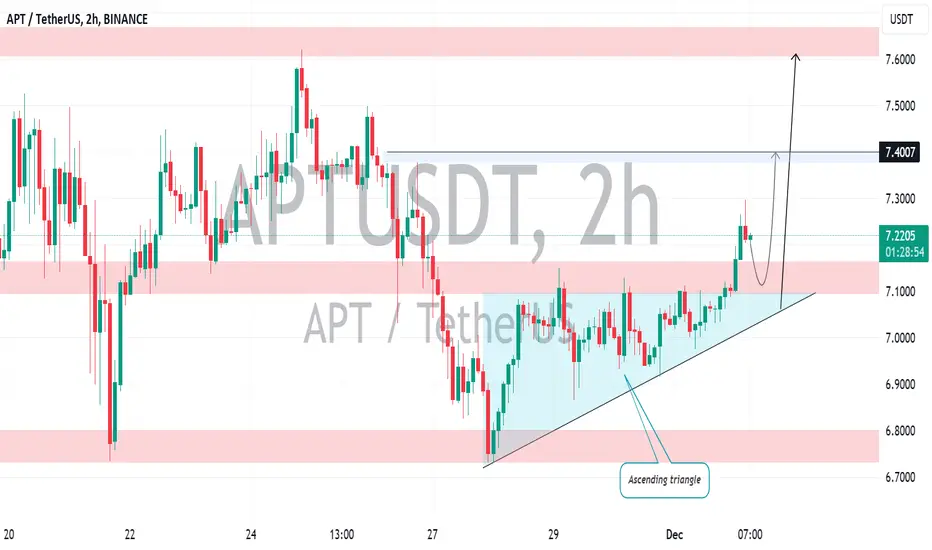
APT(APTUSDT): Important Breakout & Bullish Continuation↪️After testing the 6.800 area of support, #APT was accumulating within an upward triangle pattern for a week. The price ultimately breached and settled above its neckline today.
I hope to observe the continuation of an increase towards the objective higher high above...👍✅
APT: Bullish PennantTrade setup : Price broke above 200-day moving average, which confirmed a bullish trend reversal to an Uptrend. However, price got overbought (RSI ~ 75) just as it reached $8.00 resistance and pulled back on profit taking by traders. Now it’s consolidating in a Bullish Pennant pattern. If it breaks above $7.15, it could signal resumption of uptrend with upside potential to $8.00 or even $10.00. If it breaks below 200-day MA, it could revisit $5.40 support.
Pattern : Bullish Pennant - forms typically following a sharp advance, followed by a brief triangular shaped consolidation in price (a small change in direction), before the previous uptrend (bullish) typically resumes. The period of consolidation should have lower volume and the breakouts should occur on higher volume.
Trend : Neutral on Short-Term basis and Uptrend on Medium- and Long-Term basis.
Momentum is Mixed as MACD Line is below MACD Signal Line (Bearish) but RSI ~ 50 (Neutral).
Support and Resistance : Nearest Support Zone is $5.40 (previous resistance), then $4.70. The nearest Resistance Zone is $8.00, then $10.00.

APTAPT - Buy now and thank me later
ALL targets you see on the chart
You can buy on SPOT or long it
SL you can see also on the chart

APT 2nd Scenario Update (see previous analysis for context)This scenario is the opposite of the 1st scenario (bearish) and just like we have a fakeout out of the channel at 10th of June ($5.2) this current spike might be a fakeout too completing the wave 2-green of the developing 5 waves down.
This scenario becomes invalid the moment price touches the invalidation level on the chart.
(See 2nd scenario on page for more context)
#APT AMEX:APT

APTOS LONG on 1D timeframe APT spot (retest of the 200D MA perfectly hit). I'm bullish on this and we shiudi see ans uptrend

APTUSDT - PERPETUALEnd 2023 & Beginning 2024 Price Projection
Good opportunity at this time, Chart looks nice and healthy. There is a well-formed wave 2 on the 9-hour chart. Waves 3 (10,687), wave 4 (8,216), and wave 5 (12,052) are marked on the chart, along with the time required for their healthy development. I recommend taking small profits and reinvesting at key points (wave 4) to maximize opportunities.
SL & TP indicated on the chart.
Please manage your leverage responsibly.

APTUSDT----->15$ But First 6$ !Hello to all!
I think everything is clear enough in the chart and there is no need for additional explanation.
Of course, the daily candle hasn't been closed yet , and it may be closed in any way. However, this shooting star candle was just one of our confirmations for this BINANCE:APTUSDT analysis.
And next to the specified resistance levels and Fibonacci points and the points mentioned in the BINANCE:TRBUSDT chart analysis, I think this movement is probable.
So, the first target is 6 dollars , then the targets are 12, 15 and 20 dollars .

What can happen to $BINANCE:APTUSDT Hello dear how to trade learners, here is my opinion about the APT.
Never believe something blindly, because no one know the ultimate truth. Everything may happen in a long term.
Keep learning
Keep hustling
Keep grinding
Stay hungry

APTUSDTTime to seek liquidity
See below for liquidity zones; the price will attempt to reach these levels.
SL & TP Indicated in chart
Manage your leverage responsibly

aptIt is located between a support and resistance level. The failure of each side should be re-examined

APT/USDT planning bullish ride? 👀 🚀 Aptos Today analysis💎 Paradisers, get ready for a lucrative opportunity with APTUSDT. Currently trading in a demand zone AND there is high probability of an upward movement.
💎APTOS has a history of adhering to a descending channel pattern, breaking above it to initiate an upward trend. Presently, what was once a supply zone has transformed into a demand zone, bolstering the chances of a bullish move. The price is maintaining robust momentum above the Point of Control (POC) of the Volume Profile Visible Range (VRVP), which is now acting as a supportive base, indicating a potential bullish trajectory.
💎This situation calls for a keen understanding of the interplay between probabilities and mathematics, providing investors with a clear perspective on the risk-reward scenario.
💎 Should the price of APT fail to sustain its momentum and fall below the EMA100, we could expect a bullish continuation from the demand level at 6.1217. A breach below this level might lead to a significant downward movement towards a key support level. This scenario underscores the importance of strategic planning and market vigilance for investors.
💎Stay vigilant, strategize with probability in mind, and eagerly anticipate more insights from ParadiseFamilyVIP. We're here to guide you through the probabilistic waves of the crypto ocean.

APTOS - THE BLUEPRINTAfter several months we have finally breakout for short term retracement before we continue the downtrend. Oh yes, I believe we are still in a downtrend. Do not follow the crowd that will soon begin to chant 'ALL TIME HIGH'. One step at a time, if anything changes, I will update so turn on 🔔 to stay updated.

APT/USDT Perfect Bounce. Ready to continue Upward Movement ???💎 APT has undeniably grabbed the market's focus with its breakout from the descending channel pattern. APT has bypassed the usual retest at the resistance trendline post-breakout and has instead pierced through the supply zone.
💎 Currently, APT is poised for a retest at the demand level, previously a supply zone, marking the second occasion it has approached the $6.35 area. This positioning suggests APT may be gearing up for an ascent to create a new higher high, the probability of reaching our target in the major supply and bearish order block (OB) area.
💎 However, there's a less optimistic scenario to consider: if APT is undergoing a retest at the demand zone and fails to hold this level, it could signify a breakdown of the area. Should this occur, APT may descend to the next lower demand level at $5.475. At this juncture, it's crucial for APT to demonstrate a bounce to sustain the upward trend and reclaim the $6.35 level. A failure to uphold the $5.475 demand could trigger a bearish momentum for APT, increasing the likelihood of a retreat to the strong support zone.

Reverse in 4 level*-Technical Analysis 📈
4 movement mesuremoving at level break
*Trade (Buy/) 📊
7.03$
*-Stop Loss 🔴
6.64$
*-Take Profit 🎯
7.79 - 8.54 $
*-Risk Management 🚧
3%
👨🎓 Experience and Education: Our trading team has five years of experience in financial markets, especially cryptocurrencie

APT/USDT 1D. Aptos secondary trend. Channel.Aptos/usdt secondary and local trends.
In the secondary trend we can observe the downtrend channel. Right now the price is moving in the upper part of this channel. Stayin' near the resistance of this channel.
We've had an attempt to break this channel on aug 9, but it went unsuccessful. Retracted to the support at 4.9$(13).
Bounced from the middle of this downtrend channel. We've been in this downtrend channel for more than 180 days as for now.
Above we have the resistance of 7$. If/when the price breaks it - it goes back to the horizontal channel. If price gets above 7$ level(zone) - which previously acted as support for this big channel - then the potential to the middle(12$) and the resistance of the channel is opened(20.4$).
For this to happen, it's also necessary to break out the downtrend current channel, i believe it's obvious.
If we don't break the resistance of the channel - then first support is 4.9$(4.8) zone again. Then in will be 4.4$ and then the support of the channel at about 3.6$ zone.
Everything is shown on the chart.


APT - This time it's time for you to say goodbyeThere is a high probability that APT will start a new trend as the price rises above balance. let's watch

APT/USDTAMEX:APT
huge resistance with the green horizontal line, but that can also turn into huge support once this cup and handle pattern plays out!
target $9.60

APTUSDT.1DBased on the market data provided, the APT cryptocurrency is currently trading at 7.3304 USDT.
On the 4-hour chart, the Relative Strength Index (RSI) is at 53.21, which indicates a nearly balanced market with almost equal buying and selling pressure. The Moving Average Convergence Divergence (MACD) is at 0.0722, suggesting a slightly bullish market. The Bollinger Bands (BB) are at 7.66, indicating a moderate level of market volatility. The support levels are at 7.0308, 6.73, and 6.50, while the resistance levels are at 7.619, 8.12, and 8.30.
On the daily chart, the RSI is at 70.02, suggesting that the market is nearing overbought conditions and could potentially see a price pullback. The MACD is at 0.44, indicating a bullish market. The BB is at 7.619, suggesting moderate volatility. The support levels are at 6.84, 6.35, and 5.73, while the resistance levels are at 7.99, 8.29, and 8.89.
On the 7-day chart, the RSI is at 43.80, indicating a slightly bearish market. The MACD is at -0.54, suggesting a bearish market. The BB is at 8.050, suggesting a higher level of volatility. The support levels are at 6.63, 6.24, and 5.38, while the resistance levels are at 8.40, 9.38, and 9.69.
In conclusion, the market appears to be bullish in the short term but is nearing overbought conditions on the daily chart, which could lead to a price pullback. In the longer term, the market appears to be bearish. Therefore, careful monitoring of market conditions is advised for potential entry and exit points. As always, this analysis should be combined with further research and potentially seeking advice from a financial advisor.

APTOS: Is It Going to Dump from Here?This is my analysis on BINANCE:APTUSDT
Technically;
- The bulls are looking weak
- Bearish PA
- Bearish candle formation
- Resistance level (even this is weak)
Fundamentally;
- There is unlock schedule in next 3 days, and the unlocked coins is 10% of entire APT mcap. This will likely create sell pressure on APT in the open market.
What are your thounghts about my analysis? Share them with me in the comment box.
If this analysis makes sense to you, follow me now and support my idea.
Cheers!
