Volume and traction is coming....APTOS is gaining traction and volume, it has a huge potential...
THIS IS NOT A FINANCIAL ADVICE, PLEASE INVEST AT YOUR OWN RISK
APTUSDT trade ideas

apt finally getting ready for massive bullish rally already in uptrend and consolidating in daily timeframe seems like now consolidation getting closer to breakout incase of breakout expecting massive bullish rally towards 25$ in coming months
keep eyes on apt for confirmed breakout and do not trade without breakout

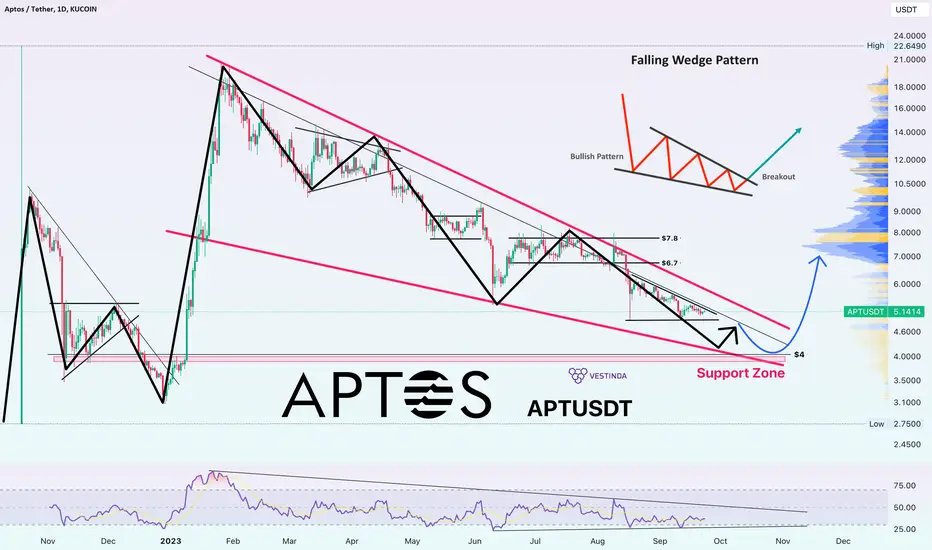
Aptos APTUSDT Price Analysis (1d)APTUSDT Price Analysis:
Aptos Token BINANCE:APTUSDT is currently displaying a descending movement within a Wedge pattern, a renowned bullish reversal formation. The present outlook suggests an impending price rebound, primarily from the Support zone positioned around the $4.0 level. Subsequently, we anticipate multiple price rebounds, ultimately culminating in a breakthrough of the Wedge's resistance.
The question arises: Can we attain our targets at $6.7 - 7.8? The answer lies in time's revelation.
Stay tuned for further updates as the market unfolds its story. 📈🕒
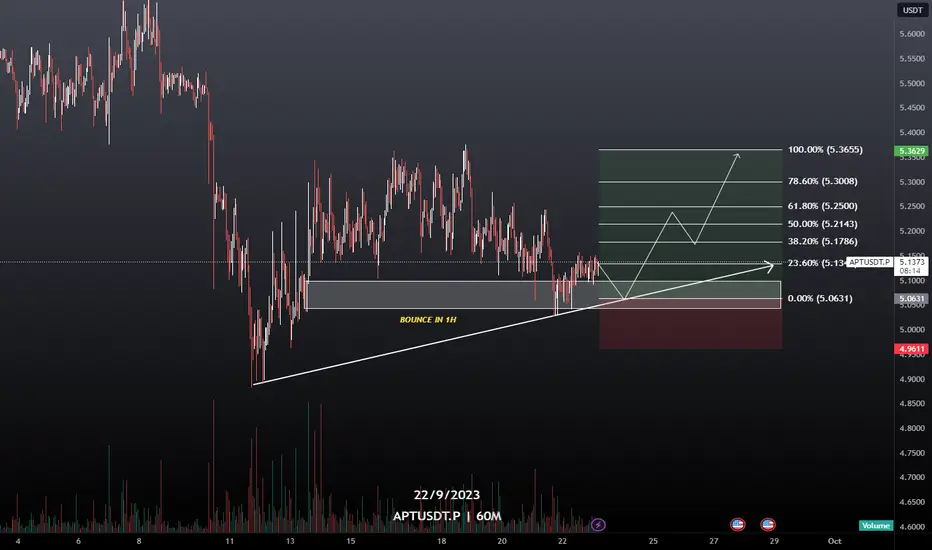
APT USDT PERPHello Trader OKX:APTUSDT.P
consistent chart and has not rejected to track the wick area. can be in
make a benchmark entry area long.
entry 5.0631
stoploss 4.9611
Please add a comment and Positive feedback and
constructive criticism are important to authors and the
community.
Disclamer: Not Financial Advice
APT Trading PlanHorizontal Supp/Resis in yellow lines
1 descending resistance line
RSI Descending resistance line
21wEMA resistance for now
likely activation within 10 days


APT : Possible reversal point APT / USDT
Price start to send bullish signal in with pin-bar candle at weekly support
Also possible breakout soon in the giant falling wedge
Best approaches:
You can buy some here with strict stoploss or wait the breakout to buy after that

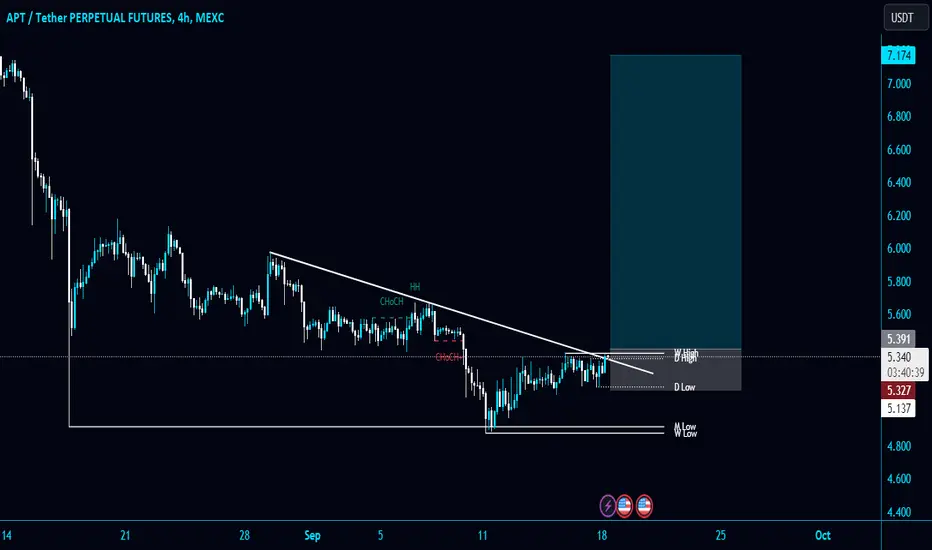
Keeping an eye on #APT/USDT Diagonal Trendline in 4-Hour TF!Keeping an eye on #APT/USDT Diagonal Trendline in 4-Hour TF!
I am expecting a bullish momentum here, if it breaks PWH $5.36. I will open a Long position after confirmation. Wait for PWH breakout to open a long.
🔥MAV and APT: SAME PATTERN, SAME PROFIT❓Both altcoins fell by -60-70% after the Binance listing and reached the accumulation area.
💥 what's next? I think you understand.
Such fresh altcoins as Aptos, Render etc. are growing very easy and we make a profit on it, but every altcoin(!) depend on Bitcoin. Let's see what's daddy have for us during the upcoming days.

🔥SUI VS APT: This Pattern Works On ALL Fresh🔋 AltcoinsSui Network is the new altcoin on Binance which has an unlimited potential.
Now the price fell by -72% and consolidating inside green area. Additional bullish signal is a potential close above $0.45 key level.
The closest worthwhile target is at $1-1.25 (+170-200%). If BTC will close above 31-34k and continue its growth, SUI can easilly grow by 4-10-50x on a bull market.
💥$300M cap can easily turn into $1B or eve more how it was with Aptos.
like❤️ and follow
Check the links and get a BONUS🎁 from me👇

Be friendly with the process
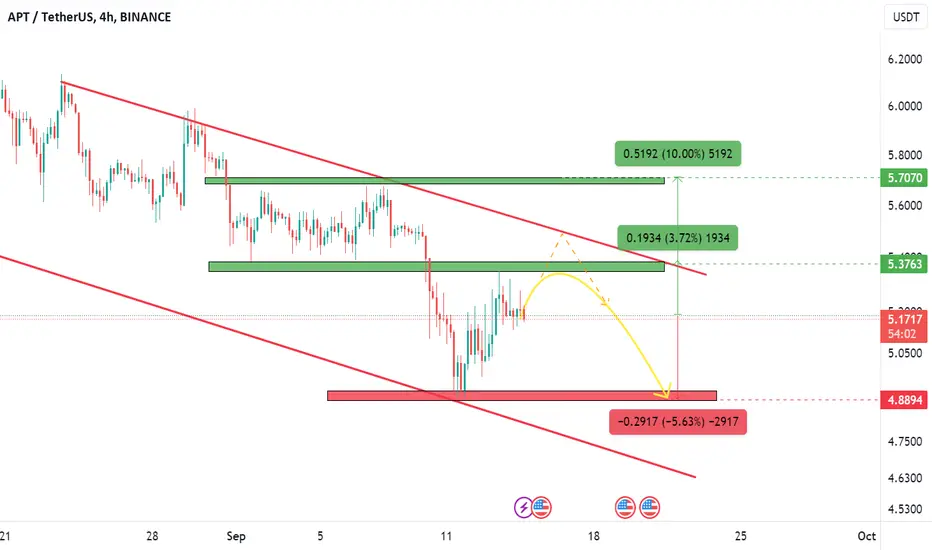
🟥 Support range: 4.8894
🔴 amount of shedding: -5%
🟩 First resistance range 5.3763
4% growth rate
🟩 Second resistance range 5.7070
Growth amount: 10%+
📊 The possibility of a 4% growth for this currency is stronger up to the first resistance range.
In case of failure of this range, there is a possibility of growth up to the ceiling of the channel, in case of failure of the first resistance, the analysis should be updated because it is important to check the strength of the failure.
APT Aptos Price Target after Court approves FTX LiquidationGiven the recent developments in the crypto space, there are several factors that point towards a bearish outlook:
FTX Liquidation of $3.4 Billion in Crypto Assets: The approval by the Delaware Bankruptcy Court for FTX to liquidate $3.4 billion in crypto assets is a significant event. This influx of a substantial amount of cryptocurrency into the market could potentially lead to an oversupply situation. When a large amount of assets is dumped into the market at once, it can put downward pressure on prices.
Limited Sales in the First Week: The imposed limit of $50 million for the first week indicates a controlled release of these assets. This may imply that FTX anticipates potential market disruption if a large volume is sold at once. However, even with controlled release, the market could still experience downward pressure.
Potential for Increased Limits: The provision for increasing the limit with the approval of the creditors’ committee and ad hoc committee, or potentially even up to $200 million weekly with court approval, shows that there's room for further selling pressure in the coming weeks.
Binance US CEO Resignation: The resignation of Binance US President and CEO, Brian Shroder, could potentially signal internal challenges within the exchange. Leadership changes in major crypto exchanges can lead to uncertainty and can impact market sentiment.
Asset List: The assets listed for liquidation include some of the major cryptocurrencies in the market such as Bitcoin, Ethereum, WBTC, WETH, USDT, SOL, XRP, STG, APT, BIT, DOGE, MATIC, FTT, TON and more. If a significant portion of these assets are sold off, it could have a widespread impact on the market.
Market Sentiment and Confidence: These events combined might lead to a loss of confidence in the crypto market, especially if investors perceive them as signs of instability or potential oversupply.
Regulatory Considerations: The fact that a bankruptcy court is involved in this process highlights the regulatory environment surrounding cryptocurrencies. Heightened regulatory scrutiny or intervention can have a dampening effect on the market.
Considering the above, my Price Target for APT Aptos is $3.10.
Looking forward to read your opinion about it.

APT/USDT decending channel breakout? 👀 🚀 Aptos Today AnalysisParadisers, pay attention! We're spotting a thrilling opportunity with APUSDT, which is currently holding a vital demand level and looks poised for a bullish surge👀
💎 The price of APT has recently indicated that the 5.0185 level serves as a key support and demand zone, potentially fueled by aggressive buying activity.
💎 Should the price break past this demand level, we could see a reversal aiming for the 4.0874 level, which is another crucial turning point.
💎 Moreover, if the price of Aptos successfully breaks out of the descending channel in an upward direction, it could present a lucrative trading opportunity.
Keep your charts updated and Stay one step ahead of the market 🌟 🌴

Aptos the Next Big One?A good project, same as SUI, but with their minor problems, the same as all other Layer 1's.
The major issue is the November Token Unlock.
What to do?
- Buy if APT reaches around 3.3$ and from there, start to DCA all the way down till 1.7$.
- In case it doesn't stabilise and the Market Makers don't pump it before november, we'll see sub 2$ for APT.
- Start to buy now, around 5.2$ and pray it doesn't go much more down. In any case, have extra cash to DCA.
Pros:
- APT is a top project for next cycle, vesting is the only problem they have right now, in this uncertain market.
- It will x20-x40 when the bullrun comes, it's almost a certainty. New project, new tech, new ideas. Old chains are gonna do x10-x15 but the projects that appeared during the last year, tend to make the biggest gains when the liquidity enters the market.
Cheers )

Initiation. Accumulation. PumpHow to trade coins after listing? Here is logic of IAP model
BINANCE:APTUSDT
When people get tokens after airdrop or launchpad, most likely on first candle we will see seller pressure. This model works in general only for fundamental projects, where even people who get tokens for free will hold it for long term. Because we got a lot of examples when this model doesn't work and price crashed under listing price. Also we need pay attention in what market period we see this listing. Because if it's a beginning of bear market this model most likely also will not works.
Initiation - Formation price imbalance in the broad price range at the time of listing
coins can be interpreted as an initiating impulse, who doesn't leave fair traded price zones on ways of its formation and in here will be be nearest target. We can use Fib from the bottom to the top candle before correction or just count only body of first Daily close candle.
Accumulation - Price reaction to price imbalance initiating impulse is
a direct indication of the presence or lack of accumulation character on the chart. Zones for accumulation before pump will be classic 0.618 / 0.71/ 0.86 levels by fib.
Pump - last stage of this model is a Pump, minimal target for this trade can be -0.27 and -0.618 level by fib where you can fix profit. On this example with Aptos it was over 500% pump. After pump depends of market stage and cycle price can continue parabolic move up or correction again to 0.5 or 0.618 level by same fib.
Hope you enjoyed the content I created, You can support with your likes and comments this idea so more people can watch!
✅Disclaimer: Please be aware of the risks involved in trading. This idea was made for educational purposes only not for financial Investment Purposes.
---
• Look at my ideas about interesting altcoins in the related section down below ↓
• For more ideas please hit "Like" and "Follow"!

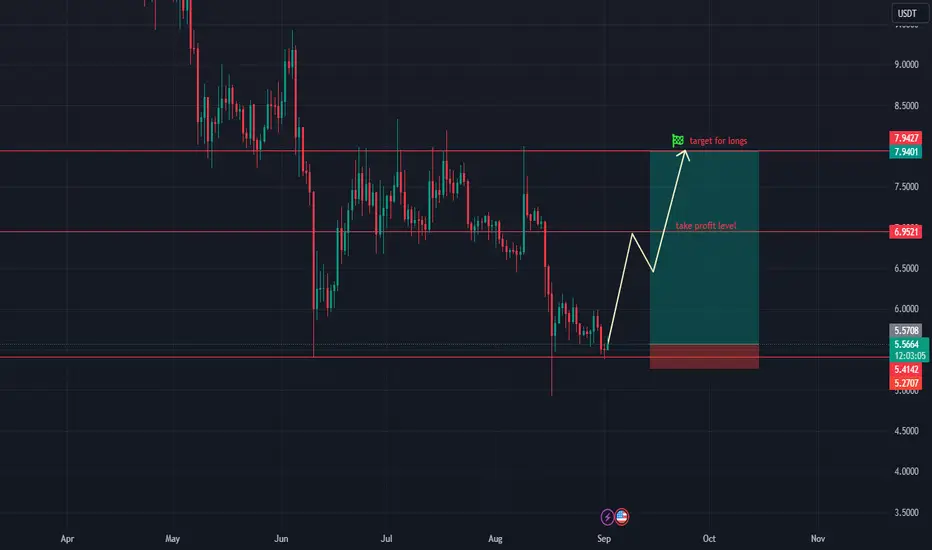
APTOS ready for a bounceLet's have a look at APTUSDT.
The price is at the lower boundary of the range now.
It may be a great time to buy APTOS and play a long towards the higher boundary of the range.
Take profit: 6.95
final target: 7.94
stop loss: 5.27
Let's get this crypto!
Leave a comment if you like our analysis!
Will APT go lower again?Hi, how are you ? Today we want to have a review on APT.
After many ups and downs, from where I entered "Start of correction", this symbol has started to fall.
According to the time-price laws of the waves, we seem to be in a large and time-consuming diametric.
Upon further investigation, we found that we are now in wave e of this diametric and we expect to see the lower green box drop.
We also have a liquidity pool in the lower areas, which I have indicated with $$$. It is expected that this pool will be filled and the movement of the IFC will be balanced and we will reach the support of the green cadre.
For risk management, please don't forget stop loss and capital management
Comment if you have any questions
Thank You


APTUSDT - we expect the price at the next resistance levelHello everyone! Let's analyze APTUSDT today. The chart shows the main support/resistance levels of the coin. Now we are testing an important resistance level again, but in addition, a trend line covers the coin from above, under which the price has been going for six months. Therefore, there are no reasons for the trend to break yet. So we are waiting for the price at the next resistance level in the area of 3.3.

$APT WHAT GOING ON?NOW I THINK AMEX:APT HAS A GOING TO WAVE B
OR
This could be WAVE 3 if it can breack B target
NFA

There could be one more potentially leg down on Aptos...' *Price Uber Allies* ' as Germans would say! Which means Price over Everything. We should not look at Fundamental Narratives & place our Trading/Investing Decisions as they more often than always put us on the wrong side of the Market. Price Action always leads ahead of any Fundamental News.
Anyways that's a topic for another day discussion.
TradingView has a very good feature so that anyone could publish Stock Ideas about a Particular Market. When I see latest ideas of Aptos right now all I see is just Bullish Setups (which I totally respect that & it could happen that this is the Final low at 5.4$ before we see it hitting all time Highs again. Don't get me wrong here these could be very smart, intelligent, sophisticated & talented people. They could be completely right about it but I just happen to very humbly disagree with them.
My main reason for disagreement is that when looked at the Long Term especially on Weekly's it still is in a Down-Trend. We just see it making a Lower Low every now & then. It becomes very important that you become Patient & not FOMO in because being Patience is key as so many good Traders say that you might already know that.
My Bearish Targets for Aptos is at 4$ because it is a Psychological level & this could be the real bottom.
When I'm wrong? My Bearish Outlook would certainly be confirmed if we see a sustained break below 5.4$ level also there is not a lot of backing of support so 4$ seems to me a very logical place it would fall. So as long as this KEY LEVEL at 5.4$ is being protected Bulls are certainly in control. There is a Brilliant Quote 'Bull Markets climb a wall of wary, while Bear Markets slide down a Slope of Hope' so maybe I might be wrong too here & all those Bullish Analysts are correct. Let's see it would certainly be quite interesting to see how things will look ahead especially we will get our another Monthly Candle close so more potential clues?
What do you think about my Bearish Outlook? Do you think I'm completely wrong here & overthinking a lot let me know if you can more than happy to hear what is going on in your head too. Thank you for reading all of this..😇

APT, Open interest rose by 100%. Something is going to happen APT, Open interest rose by 100%. Something is going to happen
watch video update

APT Dropped a lot after that OI Trap APT Dropped a lot after that OI Trap
I hope u saw previous video
