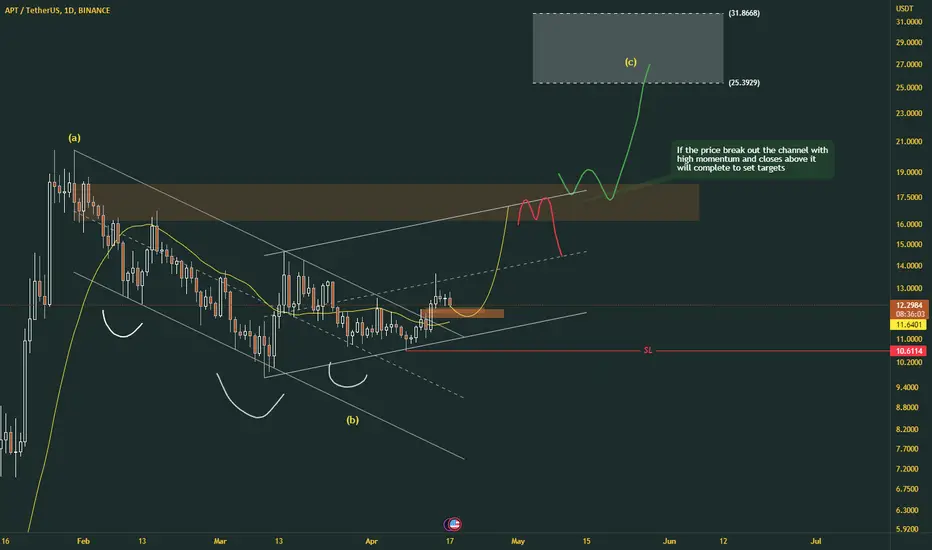
Meanwhile everything dies in May APT is the outlyerIn before hsaka tweets. Longing this 3D OB, targeting the highs and then price discovery
APTUSDT trade ideas


✅TS ❕ APTUSD: reached the support area✅✅ Aptos has reached the support area.
The chart showed a momentary reaction to the price below the support.
The asset will reverse from the current level and resume growth. ✅
🚀 BUY scenario: long to 10.7765 🚀
----------------------------------------------------------------------------
Remember, there is no place for luck in trading - only strategy!
Thanks for the likes and comments.

APTUSD ❕ broke up the rangeAptos has broken through the range upwards and is now trading above support.
The asset may continue bouncing if it fixes above support.

#APTUSDT (Watchlist) 4-2023
Consider adding this BINANCE:APTUSDT to your watchlist. Altcoins can be extremely volatile and experience significant losses during bearish cycles, so always practice good risk management.
When we suggest adding a coin to your watchlist, it means it's forming a pattern or approaching a historical bottom, near or above a good support level, displaying increased trading volume, showing a reversal candle, in an accumulation stage, etc. However, we haven't seen any bullish reaction yet, so we recommend adding it to your watchlist until the right time for entry.
Please note that we avoid trading any coin if the entire project is based on gambling, prostitution, human trafficking, borrowing, lending, etc.
This isn't financial advice, but an analysis of coin movement (not a buy or sell signal). Before following any ideas, do your own research and practice good risk management.
You can't impose your opinion or force it to happen in the cryptocurrency market. So, be prepared for any outcome.
Remember, the cryptocurrency market is highly volatile and involves both gains and losses. Understand the risks before investing.
Good luck to everyone, and we hope that Allah reconciles and repays us all. 🙏

aptusdt analysissmall range after sharp drop. most likely to continue down.
Might want to collect liquidity up until 11.00 before going back down

aptusdt dailyHi Guys , hope you well
Aptos one off the new coin and i think one of the best in future ,it have some fundamental news next week ,
and chart in on support level, it will be good for hold ,
SecondChanceCrypto
⏰25/April/23
⛔️(DYOR)
always do your research.
If you have any questions, you can write them in the comments below, and I will answer them.
And please don't forget to support this idea with your likes and comment


APTAPT CANN MOVE INTO DOWN TREND
APT coin is a cryptocurrency that aims to facilitate payments between merchants and consumers. APT stands for "Adaptive Protocol Token," and it uses a blockchain-based platform to enable fast, secure, and low-cost transactions.
One of the main features of APT coin is its adaptive network, which adjusts its transaction speed and fees based on the network load. This allows for faster and cheaper transactions during times of low network activity and higher fees during periods of high demand.
APT coin also incorporates a rewards program that incentivizes merchants to accept the coin by providing them with cashback rewards based on their transaction volume.
As with any cryptocurrency, the price of APT coin can be highly volatile and subject to market fluctuations. It's important to conduct thorough research and consider factors such as the technology, team, and community behind the coin before making any investment decisions.

🔥 APTOS Preparing For Further Drop: Ideal Bounce Area LocatedAPT has been in a steady decline since late January. With BTC taking a more bearish stance, it's to be expected that APT will also drop further.
Long-term, I'm still bullish on APT. However, there's little technical reason to buy now.
I'll start to be interested again once APT reaches the bottom support of the channel. Note that the bottom diagonal line is a direct copy of the top line, which makes it a perfect parallel channel.

APT - Bouncing from 0.618After the false breakout of APT's falling wedge pattern we are now back inside of it. The most key level is our 0.618 which was our old resistance that has now been flipped into new support. We should expect a move back up to our trendline to confirm it as resistance. We are oversold on our 12H RSI so this relief rally back to the trendline seems likely. If we can no longer hold our 0.618 price will breakdown to the bottom of our falling wedge pattern which is in confluence with our 0.786.

W9.1-3 APT BEARISH IDEA (BEARISH FLAG)Dow Theory In Place - Lower lows and lowers HIGHS Expected in Place (Trend continues)
Formation of bearish flag coupled (continuation pattern)
SL & TP Levels are defined.

#LQR #TOBTC #APTAPT is on Trading Zone on a Big Game Time Frame... Howerver
breaking any of those level will lead the Price to those Fibbonaci level Green and Red line though

APTUSDT Elliott Waves Analysis (Local Setup)Hello friends.
Please support my work by clicking the LIKE button👍(If you liked). Also i will appreciate for ur activity. Thank you!
Everything on the chart.
Wanna try, sl is short, also good RR.
Entry: market and lower
Targets: 13 - 14 - 15
after first target reached move ur stop to breakeven
Stop: ~9.7 (depending of ur risk). ALWAYS follow ur RM .
RR: 1 to 3
risk is justified
Good luck everyone!
Follow me on TRADINGView, if you don't want to miss my next analysis or signals.
It's not financial advice.
Dont Forget, always make your own research before to trade my ideas!
Open to any questions and suggestions

APT/USDT Technical Analysis: Is the Bearish Trend Here to Stay?APT/USDT Technical Analysis: Is the Bearish Trend Here to Stay?
$APT/USDT is currently trading at $11.40 and the technical analysis suggests that there could be a potential bounce in the short term. However, the overall trend remains bearish and there is a possibility of a breakdown below the HKEX:11 support level. In this article, we will take a closer look at the $APT/USDT chart and provide some key takeaways for investors.
Key Takeaways:
$APT/USDT is currently trading at $11.40
The chart suggests a potential bounce in the short term, with a possible test of HKEX:13 resistance level.
However, the overall trend remains bearish, with a possible 50% down move if there is a breakdown below the HKEX:11 support level.
There are two potential support levels to watch out for at $7.55 and $5.20.
The resistance level at $13.30 should be closely monitored as a break above this level could invalidate the bearish scenario.
Technical Analysis:
The $APT/USDT chart suggests that there could be a potential bounce in the short term, with the possibility of a test of the HKEX:13 resistance level. However, the overall trend remains bearish, with a possible breakdown below the HKEX:11 support level. If this happens, there could be a 50% down move from the breakdown level.
Investors should also keep a close eye on the potential support levels at $7.55 and $5.20. These levels could offer buying opportunities for investors who are looking to enter the market. However, if the trend reverses and breaks above the $13.30 resistance level, the bearish scenario would be invalidated.
Conclusion:
In conclusion, the $APT/USDT technical analysis suggests that the bearish trend could continue in the short term. Investors should closely monitor the HKEX:11 support level and the $13.30 resistance level for potential buying and selling opportunities. As always, it is important to conduct your own research and seek professional advice before making any investment decisions.
Follow us for More Quality Content.
Thank you.


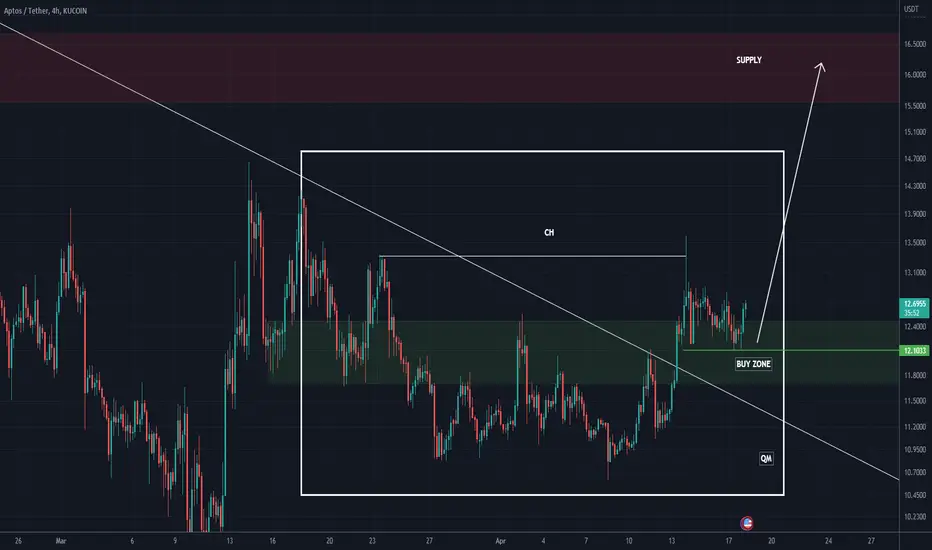
$apt long50/200 ema 4h cross trend up
price retest 50 ema 4h which is now support
nice consolidation price action over last few weeks/months

APTUSDT $APTHi
I wish you and your family always full of happiness
Buy and be sure to use the stop loss and TP you see on the picture
Don't forget your SL

APT IS BULLISHHi, dear traders. how are you ? Today we have a viewpoint to BUY/LONG the APT symbol.
For risk management, please don't forget stop loss and capital management
When we reach the first target, save some profit and then change the stop to entry
Comment if you have any questions
Thank You
LONG APTUSDTDYOR
APT looking good to buy/long in Demand area
GoodLuck guys !
*Follow for another Signal, free!

Pump party 🏄♀️ • APTUSDT APT experienced a 500% rise and now its time correction is coming to an end. The trend line has been broken and now is the time to buy. According to the ab = cd pattern, the price target is 64$