APTUSDT 1D AnalysisAPT ~ 1D Analysis
#APT Buy after successfully penetrating this resistant line with a short -term target of at least 10%+ from here.
APTUSDT trade ideas

APTUSDT - the real monster!APT has reached its strongest support level ever.
You’ll notice that price always tends to bounce from this exact zone.
This coin hasn’t moved yet, and its long-term targets are insane — definitely worth having a portion of it in your portfolio
Best regards Cecilion🎯

Aptos, Bottom Pattern: Growth Now Imminent —Alert!It does not matter the pattern shape or what name we give it; after it forms, we know the next thing that happens is growth. When a bottom pattern forms, it is followed by a period of growth. Some growth periods are bigger than others but it is always growth.
The last bottom pattern happened between mid- to late 2024 and it preceded a small sized bullish wave. The bottom pattern, accumulation zone or consolidation period, lasted some 90 days (3 months).
This time around is exactly the same. I am seeing drawings on the charts made by the candles that are exactly the same as 7 years ago. It is amazing. The exact same dynamics, always... It is so easy to spot a true bottom when the market is trading low.
Ok. Current bottom formation is some 85 days old. The same thing as before. The shape doesn't matter nor the name. There was a bullish wave that ended in the current situation, an accumulation zone or consolidation period, and this will be followed by a bull market. So this case is different to the previous one. 2024 was still part of the transition, 2025 is the bull market year.
The only reason we can know these things is because of experience and the charts.
Without experience, it is really hard to make sense of what is going and to understand the market.
Sometimes I detach for several months and I when I comeback I start from zero and wow, I understand why people become anxious when I am not publishing these charts. It is just hard to read, how to understand. If someone like me is doing this work daily, a bigger picture of the market develops, a broader perspective develops and you can grasp easily, understand what is happening and you can also hold easy long-term.
Just watch. I will show you by disappearing for a few days or weeks when the market shakes. Even though I've been sharing the bigger picture you'll see how your mind becomes clouded... It is just hard when we don't know what to look for. That will be a lesson for another day.
Today, I am revealing everything the market will do before it does it.
Thanks a lot for your continued support.
» Aptos is about to enter a strong bullish wave. 100% certainty level.
Thank you for reading.
Namaste.

Formed Bullish Pattern APT
Formed Bullish Pattern
APT
has formed a bullish pattern and is approaching a key red resistance zone. A breakout above this level could signal a strong bullish move, with the first target at the green line level.
📈 Technical Overview:
Pattern: Bullish
Resistance Zone: Red area currently being tested.
🎯 Breakout Target: Green line level upon confirmation.

Aptos Will Prove Its Worth (Daily Analysis)After breaking out from a simple trendline, Aptos (APT) has gained significant momentum, similar to many other altcoins over the past two weeks.
However, Aptos is currently presenting a unique structural situation. It appears to have completed a full five-wave bearish impulse and has now transitioned into a new five-wave bullish impulse. From a daily timeframe perspective, Aptos seems to be developing wave 1 of this new cycle.
A closer examination of Aptos’ historical price movements reveals some interesting patterns: • During the previous bullish phase, Aptos formed a reversed Head and Shoulders pattern. • Following the breakout of a key trendline, Aptos rallied to levels that were largely unexpected by the market. • The previous cycle took exactly four months to reach its lower high, aligning precisely with the Fib Time Zone (Level 4) before retracing.
Assuming that history tends to repeat itself (and being conservatively pessimistic), Aptos could potentially reach the $10 region again this summer.
There are two major additional reasons supporting this outlook:
Wave 3's potential target in this cycle aligns perfectly with a high-liquidity zone, increasing the probability of a strong upward move. (Refer to the previous bullish cycle’s Wave 3 in the Fib retracement for additional confirmation.)
A new reversed Head and Shoulders pattern appears to be forming right now, which, if confirmed, would further strengthen the bullish case.
Using the Fib Time Tool again, the estimated timeline for reaching the target without any major pattern formation points to late July.
However, if the Head and Shoulders structure fully forms before the breakout, it could extend the move by an additional month, but would likely result in a much higher target beyond $10.
Invalidation level for this analysis: Below the $4 mark.
— Thanks for reading.

OB APT/USDT - HamadOB APT/USDT - Hamad
identify the Order Block,
How to Identify Order Blocks:
Identifying order blocks involves looking for specific price action patterns and characteristics on a chart. Here's a breakdown of key elements to look for:
Impulsive Move: Order blocks are typically formed just before a strong, directional price movement (an "impulsive move"). This move suggests that the large orders within the block were the catalyst for the price surge or decline.
Consolidation or Accumulation/Distribution: Before the impulsive move, you'll often see a period of consolidation or sideways price action. This represents the area where the large orders were being accumulated (before a bullish move) or distributed (before a bearish move) without causing a significant price change initially.
The Last Opposing Candle: The most commonly identified order block is the last candle that moves in the opposite direction of the subsequent impulsive move.
Bullish Order Block: In an uptrend, look for the last bearish (down) candle before a strong bullish (up) move breaks above previous highs. The range of this last bearish candle becomes your bullish order block.
Bearish Order Block: In a downtrend, look for the last bullish (up) candle before a strong bearish (down) move breaks below previous lows. The range of this last bullish candle becomes your bearish order block.
Significant Volume: While not always explicitly visible on standard candlestick charts, order blocks often coincide with higher-than-average trading volume during their formation and the subsequent impulsive move. Volume indicators can help confirm the presence of institutional activity.
Engulfing Patterns: Some traders look for engulfing candlestick patterns as potential order blocks, where a larger candle "engulfs" the previous smaller candle(s), indicating a strong shift in momentum.
Unmitigated Zones: A key characteristic of a potentially strong order block is that price has not yet returned to fully test or "mitigate" it after its formation. The idea is that the remaining unfilled orders within this unmitigated block could cause a strong reaction when price eventually revisits it.
Steps to Identify Order Blocks:
Identify a Strong Trend or Impulsive Move: Look for significant price движения that break structure (swing highs or lows).
Locate the Consolidation or Range Before the Move: Pinpoint the area where price was trading sideways before the impulsive move began.
Find the Last Opposing Candle: Identify the last candle that moved against the direction of the impulsive move within or at the end of the consolidation.
Mark the Order Block: Draw a zone encompassing the high and low (or open and close, depending on the strategy) of that last opposing candle.
Consider Volume (Optional): Use volume indicators to see if there was significant activity during the formation of the potential order block.
Look for Unmitigated Zones: Determine if the price has already returned to and significantly interacted with the identified order block. Unmitigated blocks are often considered higher probability.
Important Considerations:
Order blocks are not always perfect predictors of future price action.
They work best when used in confluence with other technical analysis tools and an understanding of market structure and liquidity.
Higher timeframe order blocks tend to be more significant than those on lower timeframes.
Not every large candle is an order block. Context is crucial. Look for the characteristics mentioned above.
By understanding what order blocks are and how to identify them, traders can gain valuable insights into potential areas of institutional interest and improve their trading strategies.

$APT Weekly Rebound – Massive Upside Ahead?
Aptos ( AMEX:APT ) has just completed a third major falling wedge breakout right at a critical long-term support zone. This pattern has historically led to strong bullish follow-through — and this time, the structure is even cleaner and deeper. 📈
🔹 Current Price: $5.55 🔹 Technical Breakout: Confirmed on weekly chart 🔹 Momentum Building: Structure aligns with prior explosive rallies
🎯 Next Potential Targets:
T1: $10.62
T2: $16.03
🎯 T3: $2.90

#APT/USDT
#APT
The price is moving within a descending channel on the 1-hour frame, adhering well to it, and is heading for a strong breakout and retest.
We are experiencing a rebound from the lower boundary of the descending channel, which is support at 4.75.
We are experiencing a downtrend on the RSI indicator that is about to be broken and retested, supporting the upward trend.
We are looking for stability above the 100 Moving Average.
Entry price: 4.95
First target: 5.06
Second target: 5.17
Third target: 5.28

APT BUYHello friends
Due to the price increase, you can now see that the price is correcting, so we have identified good support levels for you to buy in steps and with capital management and targets.
*Trade safely with us*

APTUSDT → Retest of the liquidity zone. Downward trendBINANCE:APTUSDT.P failed to realize its potential. The price made a false breakout of resistance and formed a reversal pattern. Correction or continuation of the downtrend?
Bitcoin is rebounding from resistance. Technically, the market may enter a correction or consolidation. Altcoins are reacting accordingly — correction
Within the downtrend but local ALT rally, APT failed to realize its potential and formed liquidity accumulation and a false breakout of the downtrend channel resistance before a possible decline...
Resistance levels: 5.2, 5.458
Support levels: 4.76, 4.48, 4.17
A consolidation of the price below the trend resistance or below 5.20 could trigger a continuation of the global and local trends. The coin is likely to remain near the bottom and test new lows...
Best regards, R. Linda!

APT Is Squeezing Into a Reversal Pattern at a Key Weekly Level!Yello, Paradisers! Is #APT quietly gearing up for one of the cleanest reversal plays we’ve seen in weeks?
💎After a long, relentless downside trend, APT is now starting to show signs of life. The price action is compressing inside a classic falling wedge pattern, and more importantly, this is happening right at a weekly key level — the kind of setup that usually leads to significant shifts when confirmed.
💎What’s adding more weight here is the emergence of a bullish divergence on the indicators, suggesting that while price has been making new lows, momentum has already begun to turn. That’s often one of the first early signs of a coming reversal and it’s starting to gain strength.
💎#APTUSDT is now pressing against a decisive resistance zone. The price is testing the 12-hour EMA-50, currently sitting around $5.33, and just slightly above that, the wedge breakout trendline stands at approximately $5.45. These two levels are acting as the immediate gatekeepers for a bullish shift.
💎Breaking through both of these zones will be crucial. If the bulls succeed, we can expect a push toward the $7.00 – $7.35 region — a zone where short-term traders may look to take profits. However, if the momentum continues, the bigger step lies ahead.
💎A sustained breakout could carry APT to the pattern target of $8.75 – $9.25 area. This is a strong resistance zone and this is where things get more challenging. The resistance in this range is reinforced by multiple technical confluences, including the 50% Fibonacci retracement, which often acts as a magnet but also a serious barrier during recoveries.
💎On the flip side, support remains solid. Immediate support is at $4.95, while beneath that, APT sits on a major structural base that has historically held firm. Sellers will need serious volume to crack below this foundation and for now, that pressure isn’t there.
Paradisers, strive for consistency, not quick profits. Treat the market as a businessman, not as a gambler.
MyCryptoParadise
iFeel the success🌴

Aptos Preparing For A New All-Time High —$22.22, $33.33 & $44.44Good morning my fellow Cryptocurrency trader, I hope you are having a wonderful day.
Here we have a pretty nice dynamic on the Aptos (APTUSDT) chart. There is a sequence of long-term lower highs and lower lows, yet the chart looks solid and strong.
These lower lows and lower highs are not a bearish trend but rather a long-term, wide consolidation channel. April 2025 produced the lowest prices since Aptos initial low in December 2022.
From a TA perspective, seeing a reversal happening after this event is good news. The August 2024 stop-loss orders placed below this low have been activated, the same for October 2023. This means that liquidity is no longer on the downside. Once support has been challenged, the action moves toward resistance.
While these major support levels were pierced, this only happened for a few days. Now, APTUSDT is trading back above both those low points and this makes the market extremely bullish.
The Altcoins are growing but Bitcoin is not yet trading above 100K. The Altcoins tend to follow Bitcoin, if Bitcoin grows, the entire Cryptocurrency market grows.
The fact that many Altcoins are moving ahead and producing 2-3 digits green means that this is the real deal, we are ready for the 2025 bull market. This is to say, that the next rise for Aptos will not end in another long-term lower high, we are set to experience a new All-Time High. This is seen on the chart as $22.222, $33.333 and $.44.444. These are the levels for this bull market cycle.
When Bitcoin moves above 100K, expect the Altcoins market to explode!
Thank you for reading and for your continued support.
Namaste.

APT/USDT:BUYHello friends
Given the good price growth, we see that the price is in an ascending channel and has fallen, we can buy in a stepwise manner in the price decline within the specified ranges and move with it to the specified targets.
Observe capital and risk management.
*Trade safely with us*

#APT/USDT#APT
The price is moving within a descending channel on the 1-hour frame, adhering well to it, and is heading toward a strong breakout and retest.
We are experiencing a rebound from the lower boundary of the descending channel, which is support at 4.50.
We are experiencing a downtrend on the RSI indicator, which is about to break and retest, supporting the upward trend.
We are heading toward stability above the 100 Moving Average.
Entry price: 4.55
First target: 4.65
Second target: 4.74
Third target: 4.86

Aptos Low Prices (Bottom) Means Bullish —6000X PotentialIt has been 126 days since Aptos produced its last peak, 2-December 2024. The last major low happened on the 5-August 2024 session. The action this week pierced below the Aug. low and moved back above it. The action this week activated the same low levels as in early January 2023, more than two years ago.
So Aptos grew and did so nicely but this is all part of a wide sideways phase. After the last bullish wave, a full correction followed deleting more than 100% of all gains. A full market flush. This means the doors are now open for maximum growth. Bottom prices. The best possible.
Timing is right. Timing is great. Regardless of the outcome; please, keep this in mind, regardless of the outcome this is a great buy zone. That is because we buy when prices are trading low, relative to past action, or at a strong support level. This is a very strong support level that was just activated.
The market can always produce additional moves after support is hit, swings and shakeouts, but these should be ignored and recognized as market noise. If prices move lower, we buy more and wait patiently, we hold. All you need to do is to buy and wait, when the market starts moving, you will be glad you took action, you can't get it wrong with a simple spot trade. Buy and hold. You will be happy with the results.
Thank you for reading.
Your support is appreciated.
Namaste.

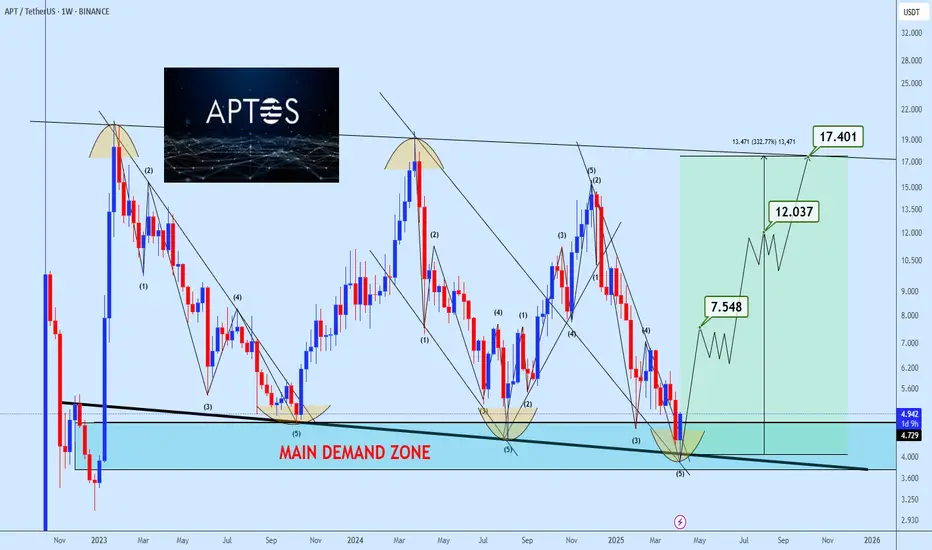
APTOS Triple Reversal: Is This the Macro Bottom?APT is exhibiting a potential triple bottom formation, reinforced by a series of completed 5-wave declines terminating within a strong demand zone. The structure points to a possible macro reversal with staged recovery targets at 7.548, 12.037, and a full breakout extension toward 17.401. This bullish outlook remains valid as long as the current base around 4.729 holds. Momentum confirmation will be key to validating this shift in trend. Risk-reward now heavily favors early positioning.
Aptos long to $4.9 Tonight!EURONEXT:APTOS long.
DTT method applied.
Almost 4RR potential
3.-3.86RR (edited)

APTUSDT 4DAPT ~ 4D Analysis
#APT Buy back when testing this support with a short -term target of at least 20%+ from here.

Apt may fall further.Very difficult days are ahead for Apt.
* The purpose of my graphic drawings is purely educational.
* What i write here is not an investment advice. Please do your own research before investing in any asset.
* Never take my personal opinions as investment advice, you may lose your money.

APTThe currency has completed the five corrective waves and now begins to rise to the third wave, which is the longest.

APT Way Down For Long LiqudationsAptos recently hunted lots of short positions during last crash. In February 2 most of the assets crashed a lot. And there is still remaining liquidity and imbalances within the last long wick.
APT has formed a bearish flag in it's consolidation rectangle. It's headed trough 4.5$.
Thanks for reading.

TradeCityPro | APTUSDT The Beginning of a New Downtrend!👋 Welcome to TradeCityPro Channel!
Let's go back to the day when Trump imposed tariffs on the United States again, causing stocks and cryptocurrencies to fall and gold to rise. Let's take a look at our attractive altcoin chart
🌐 Overview Bitcoin
Before starting the analysis, I want to remind you again that we moved the Bitcoin analysis section from the analysis section to a separate analysis at your request, so that we can discuss the status of Bitcoin in more detail every day and analyze its charts and dominances together.
This is the general analysis of Bitcoin dominance, which we promised you in the analysis to analyze separately and analyze it for you in longer time frames.
📊 Weekly Timeframe
APT remains inside its large, volatile range, frequently bouncing between its highs and lows. However, this time, it has formed a lower high, which is not a positive sign.
Additionally, after breaking $7.78, sellers completely engulfed the weekly candle, and for the past five weeks, all candles have been red with high selling volume, confirming the downtrend.
There is no buy trigger at the moment, and I cannot recommend a buying opportunity until the market forms a new structure.
For selling, if APT drops below $4.97, it makes sense to exit and accept the loss instead of holding onto a losing position.
📉 Daily Time Frame
In the daily time frame, the power is in the hands of the sellers! After the parabolic line broke, we experienced a Sharpe decline, accompanied by the formation of a lower ceiling and floor, which has continued our downward trend.
The parabolic movement itself is a very rapid and bullish movement, and every time the price hits it, it quickly returns to its trend and is supported, but when this line is broken, that trend is practically over and we suffer, or we experience a Sharpe decline like this chart!
After the drop and the formation of a box between 5.136 and 6.491, the selling force was clearly evident in this space, because the last time we moved towards the ceiling of 6.491, we could not reach this ceiling and we were rejected earlier.
This rejection made us return to this support faster with a number of red candles, unlike the previous attempt where we moved up with a larger number of candles. Yesterday's daily candle also engulfed the previous 3 candles and is exactly ready to break 5.136.
If today's daily candle closes in the same way, the probability of a drop in the coming days will increase and increase. If you are a holder of this coin, it is logical to sell and after returning to the box and breaking its ceiling, buy with the same number of Tethers and reduce the probability of a drop and loss of capital for yourself!
✍️ Final Thoughts
Stay level headed, trade with precision, and let’s capitalize on the market’s top opportunities!
This is our analysis, not financial advice always do your own research.
What do you think? Share your ideas below and pass this along to friends! ❤️

#APT/USDT#APT
The price is moving within a descending channel on the 1-hour frame and is expected to continue upward.
We have a trend to stabilize above the 100 moving average once again.
We have a downtrend on the RSI indicator, supporting the upward move with a breakout.
We have a support area at the lower boundary of the channel at 5.20.
Entry price: 5.41
First target: 5.46
Second target: 5.58
Third target: 5.70
