−0.0007 GBP
−2.00 M GBP
0.00 GBP
3.21 B
About ROCKFIRE RESOURCES PLC ORD GBP0.001
Sector
Industry
CEO
David William Price
Website
Headquarters
London
Founded
2011
ISIN
GB00B42TN250
FIGI
BBG003MD0G77
Rockfire Resources Plc is an exploration company. It operates exploration projects in Lighthouse, Marengo, Copperhead and Copper Dome. The company was founded on September 29, 2011 and is headquartered in London, the United Kingdom.

Summarizing what the indicators are suggesting.
Oscillators
Neutral
SellBuy
Strong sellStrong buy
Strong sellSellNeutralBuyStrong buy
Oscillators
Neutral
SellBuy
Strong sellStrong buy
Strong sellSellNeutralBuyStrong buy
Summary
Neutral
SellBuy
Strong sellStrong buy
Strong sellSellNeutralBuyStrong buy
Summary
Neutral
SellBuy
Strong sellStrong buy
Strong sellSellNeutralBuyStrong buy
Summary
Neutral
SellBuy
Strong sellStrong buy
Strong sellSellNeutralBuyStrong buy
Moving Averages
Neutral
SellBuy
Strong sellStrong buy
Strong sellSellNeutralBuyStrong buy
Moving Averages
Neutral
SellBuy
Strong sellStrong buy
Strong sellSellNeutralBuyStrong buy
Displays a symbol's price movements over previous years to identify recurring trends.
Related stocks
Frequently Asked Questions
The current price of ROCK.GB is 0.0898 GBX — it hasn't changed in the past 24 hours. Watch ROCKFIRE RESOURCES stock price performance more closely on the chart.
Depending on the exchange, the stock ticker may vary. For instance, on AQUIS exchange ROCKFIRE RESOURCES stocks are traded under the ticker ROCK.GB.
ROCK.GB stock has fallen by −1.21% compared to the previous week, the month change is a 3.93% rise, over the last year ROCKFIRE RESOURCES has showed a −52.69% decrease.
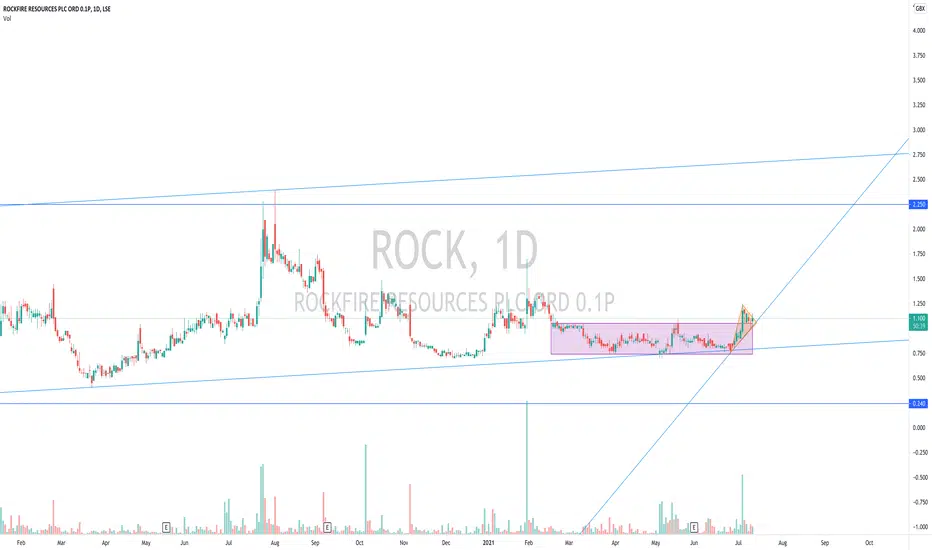
ROCK.GB reached its all-time high on Jul 3, 2018 with the price of 2.4390 GBX, and its all-time low was 0.0766 GBX and was reached on May 20, 2025. View more price dynamics on ROCK.GB chart.
See other stocks reaching their highest and lowest prices.
See other stocks reaching their highest and lowest prices.
ROCK.GB stock is 0.22% volatile and has beta coefficient of 0.04. Track ROCKFIRE RESOURCES stock price on the chart and check out the list of the most volatile stocks — is ROCKFIRE RESOURCES there?
Today ROCKFIRE RESOURCES has the market capitalization of 3.84 M, it has increased by 9.08% over the last week.
Yes, you can track ROCKFIRE RESOURCES financials in yearly and quarterly reports right on TradingView.
ROCK.GB net income for the last half-year is −1.11 M GBP, while the previous report showed −887.57 K GBP of net income which accounts for −25.42% change. Track more ROCKFIRE RESOURCES financial stats to get the full picture.
No, ROCK.GB doesn't pay any dividends to its shareholders. But don't worry, we've prepared a list of high-dividend stocks for you.
Like other stocks, ROCK.GB shares are traded on stock exchanges, e.g. Nasdaq, Nyse, Euronext, and the easiest way to buy them is through an online stock broker. To do this, you need to open an account and follow a broker's procedures, then start trading. You can trade ROCKFIRE RESOURCES stock right from TradingView charts — choose your broker and connect to your account.
Investing in stocks requires a comprehensive research: you should carefully study all the available data, e.g. company's financials, related news, and its technical analysis. So ROCKFIRE RESOURCES technincal analysis shows the sell today, and its 1 week rating is sell. Since market conditions are prone to changes, it's worth looking a bit further into the future — according to the 1 month rating ROCKFIRE RESOURCES stock shows the sell signal. See more of ROCKFIRE RESOURCES technicals for a more comprehensive analysis.
If you're still not sure, try looking for inspiration in our curated watchlists.
If you're still not sure, try looking for inspiration in our curated watchlists.