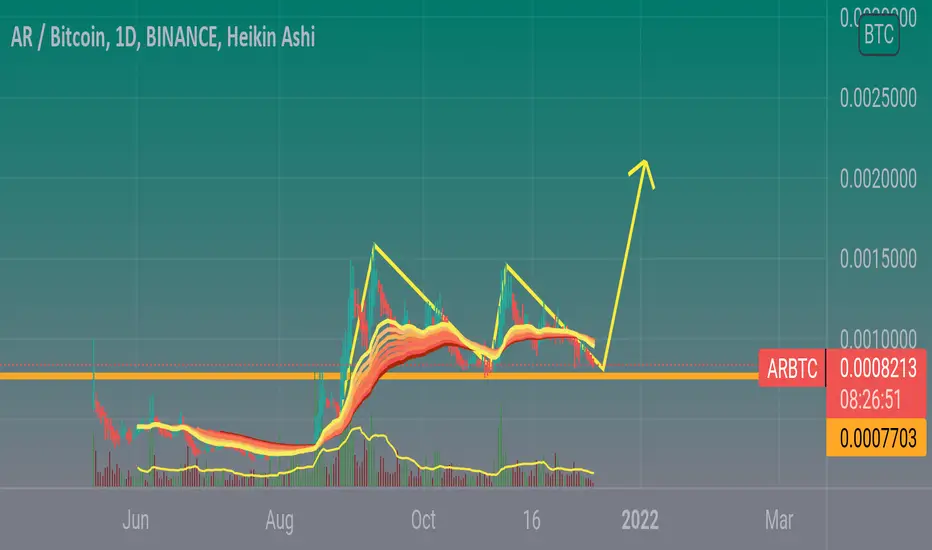
Arweave | Easy & Simple ~300% Bullish WaveThis chart setup, I can call it easy and simple but should also add the word fast. Somehow, I am getting the feeling that this pair can move fast.
A strong and prolonged down-wave tends to be followed by a strong bullish wave.
Notice the bearish impulse as in 1,2,3,4,5 based on the Elliott Wave principle. You can clearly count five main waves within this long correction phase when it comes to the ARBTC trading pair.
This chart setup opens the possibility for a surprise bullish jump.
The setup has low risk because it is trading very close to the last low. The potential is very higher, a good risk reward ratio. This is an easy chart.
— General Market Talk
The Altcoins market is heating up now and many pairs are starting to look great. A pair that looks great is not one that is growing strong or one that produced a strong bullish breakout with 50-60% growth today, but rather a pair that is trading near support and ready to grow. That's the meaning of great.
A strong bullish breakout is awesome, can be good, but only if we already bought. If the action starts and yet we have not buy then there is nothing good about seeing prices going up. It is great when we are in and our capital grows.
Many of the Altcoins now are looking great because they are yet to grow. It is ultra-wise to get in early; buy and hold.
I've been looking at hundreds of charts and the bullish bias is fully confirmed. I mentioned this a while back while tracking Bitcoin, I know that you can easily agree with me.
Knowing this, how to proceed?
Let's see how Arweave performs next.
I will continue to share unique content and great charts; great timing.
You can continue to be awesome.
Thank you for reading.
Your support is appreciated.
Namaste.
ARBTC trade ideas

Analyzing ARBTC: Next Potential Breakout Zones - Arweave◳◱ On the $AR/ CRYPTOCAP:BTC chart, the Trend Reversal pattern suggests a pause in volatility, potentially gearing up for a breakout. Traders might observe resistance around 0.0002543 | 0.0002838 | 0.0003536 and support near 0.0001845 | 0.0001442 | 0.0000744. Entering trades at 0.0002567 could be strategic, aiming for the next resistance level.
◰◲ General info :
▣ Name: Arweave
▣ Rank: 82
▣ Exchanges: Binance, Kucoin, Huobipro, Hitbtc
▣ Category/Sector: Services - File Storage
▣ Overview: Arweave is a data storage protocol built on blockweave technology. Arweave is developing an underlying network where data can be stored forever and accessed on its permaweb, a secondary layer where data is accessible in a human-readable manner (e.g. via web browsers).
◰◲ Technical Metrics :
▣ Mrkt Price: 0.0002567 ₿
▣ 24HVol: 14.523 ₿
▣ 24H Chng: 2.557%
▣ 7-Days Chng: 19.36%
▣ 1-Month Chng: 61.44%
▣ 3-Months Chng: 16.64%
◲◰ Pivot Points - Levels :
◥ Resistance: 0.0002543 | 0.0002838 | 0.0003536
◢ Support: 0.0001845 | 0.0001442 | 0.0000744
◱◳ Indicators recommendation :
▣ Oscillators: NEUTRAL
▣ Moving Averages: STRONG_BUY
◰◲ Technical Indicators Summary : BUY
◲◰ Sharpe Ratios :
▣ Last 30D: 4.00
▣ Last 90D: 0.95
▣ Last 1-Y: 1.45
▣ Last 3-Y: 0.30
◲◰ Volatility :
▣ Last 30D: 1.39
▣ Last 90D: 1.11
▣ Last 1-Y: 1.34
▣ Last 3-Y: 1.18
◳◰ Market Sentiment Index :
▣ News sentiment score is N/A
▣ Twitter sentiment score is N/A
▣ Reddit sentiment score is N/A
▣ In-depth ARBTC technical analysis on Tradingview TA page
▣ What do you think of this analysis? Share your insights and let's discuss in the comments below. Your like, follow and support would be greatly appreciated!
◲ Disclaimer
Please note that the information and publications provided are for informational purposes only and should not be construed as financial, investment, trading, or any other type of advice or recommendation. We encourage you to conduct your own research and consult with a qualified professional before making any financial decisions. The use of the information provided is solely at your own risk.
▣ Welcome to the home of charting big: TradingView
Benefit from a ton of financial analysis features, instruments and data. Have a look around, and if you do choose to go with an upgraded plan, you'll get up to $30.
Discover it here - affiliate link -

Grow Your Capital Level Expert: Trading Simplified—Explained!It takes time... One needs to be patient but the strategy works. Only one action is needed, that is to buy and hold.
It can take time but it works if you wait. Buy low near support (red on the chart). Sell high near resistance (when prices are moving up).
This is very simple, the levels are shown on the chart.
You can start with 2-3 trades and increase as your capital grows. If you have a big capital you can start with 5, putting 20% on each trade. Spot for low risk.
If your capital is really big, you can start with 10 pairs, 10% each or with 20 pairs, 5% each... And just retreat. You let the market take care of the rest.
When a pair grows 200%, 300%. You sell and do nothing. Wait patiently until you find another low pair and repeat the same. Buy and hold. Patience is key, the market takes care of the rest.
The strategy works but it requires for you to wait. You just have to have patience... If you think it will take three months, then be prepare to wait for ten (10). If you are ready to wait one year, prepare to wait for three years...
Thank you for reading.
Namaste.

Arweave: Next Target Based Fibonacci Extension (270% Potential)On the 8-April week we have a major low with a long lower wick, notice the chart. This session leads to a move higher and then the continuation of the correction.
The correction is now stopping at a higher low, the16-Sep week. This week is starting full green and as this happens a breakout from a falling wedge pattern is also taking place.
These are early signals, pointing toward the resumption of the bullish move.
The next target sits at 270% based on Fibonacci extensions. This is a strong and at the same time easy target.
After this target is hit we can expect another correction and then an even higher target being hit also shown on the chart.
If market conditions change, we adapt to the market; update the map and don't fight with the trend.
This chart setup is easy to trade with a tight stop.
Low risk, vs a high potential for reward.
These signals are good and these charts are good but this does not mean that the market will move in a certain way. Market conditions can always change.
If there is a crash, we sell at a loss. We take the loss and move on.
If prices move up as predicted, that is a win. We take the profits and move on.
Namaste.

#ARBTC #1W (Binance) Huge descending channel breakout and retestArweave seems about to print a dragonfly doji above 100EMA weekly support, looks like a great swing opportunity in sats.
⚡️⚡️ #AR/BTC ⚡️⚡️
Exchanges: Binance
Signal Type: Regular (Long)
Amount: 3.1%
Current Price:
0.0004235
Entry Targets:
1) 0.0004080
Take-Profit Targets:
1) 0.0010729
Stop Targets:
1) 0.0002749
Published By: @Zblaba
CRYPTOCAP:AR BINANCE:ARBTC #Arweave #Web3 #Storage arweave.org
Risk/Reward= 1:5.0
Expected Profit= +163.0%
Possible Loss= -32.6%
Estimated Gaintime= 6-10 months

✳️ Arweave | Bear-Market vs Recovery Year vs Bull-MarketLook at this chart... We have another bullish chart on the ALTSBTC category. How many of these charts have we seen so far? 30, 35, 40? All these are 100% bullish with many already growing.
That's the difference between a bull-market and a "recovery year".
Last year, which I dubbed the recovery year, only a small portion of the Cryptocurrency market recovered, moved forward. In a bull-market, the majority of the projects will grow strong and hit new All-Time Highs.
➖ So a small portion doing good and recovering vs the majority growing strong.
➖ While in a bear-market everything drops.
👉 Prepare for major growth in 2024.
Don't get me wrong, any correction on any section of the market is only temporary and noise when considered within the bigger picture. We are set for a very strong 2025 and 2024.
➖ 2024 Will be equivalent in terms of market action to 2020;
➖ 2025 Will be equivalent in terms of market action to 2021!
Namaste.

Arbtcit move now in channel and may make agood move in mid term
dont forget to set stoploss
Trading without clear targets and stoploss have inly one end : Losing everything
Give me your feedback in comment

#AR/BTC - Long - Potential 6.64%Direction: Long
Market: Spot
Risk: 0.25% - 1%
#BTC_AR
Exchange: BINANCE
Timeframe: 360
TP1: 0.0002119
Entry: 0.0001982
STOP: 0.0001845
Entry Conditions:
| Consolidation break
| RVD break

$AR/#BTC [#Arweave]: Resistance_Breakout• Hey traders, we've identified a Resistance Breakout on the $AR / $BTC chart. The price has broken above a key resistance level, which can indicate a potential bullish trend. Taking in consideration the next resistance key levels are at 0.0005752 | 0.0006394 | 0.0007597 and the major support zones are respectively at 0.0004549 | 0.0003988 | 0.0002785. It is a bullish indication and we may consider entering at the current price zone at 0.0005567 and targetting higher levels.
Technical Metrics :
• Current price: 0.0005567
• 24H Volume: 85.5243
• 24H Price change: 12.875%
Pivot Points - Levels :
• Resistance: 0.0005752 | 0.0006394 | 0.0007597
• Support: 0.0004549 | 0.0003988 | 0.0002785
Indicators recommendation :
• Oscillators: BUY
• Moving Averages: STRONG_BUY
Technical Indicators Summary : BUY
Market Sentiment Index :
• News sentiment score is N/A
• Twitter sentiment score is 0.60 - Bullish
• Reddit sentiment score is 0.64 - Bullish
In-depth ARBTC technical analysis on Tradingview TA page
• What do you think of this analysis? Share your insights and let's discuss in the comments below. Your like, follow and support would be greatly appreciated!
• Welcome to the home of charting big: TradingView
Benefit from a ton of financial analysis features, instruments and data. Have a look around, and if you do choose to go with an upgraded plan, you'll get up to $30.
Discover it here

ARBTCHi
The ARBTC currency pair will grow according to the chart. If it breaks its daily trend, we will expect a higher growth.

ARBTC | FALLING WEDGE BREAKOUTARBTC has been trading in bearish trend which is well respected by falling wedge . Recently the price has broken the falling wedge and price successfully sustain above it then long positions can be taken. The bulls need to break above horizontal resistance zone .
Trade your levels accordingly.

ARBTC | DECISION TIMEARBTC has been in downtrend from last 2 months. The price has been trading with in a falling wedge .
Now the price has been trading at upper boundary of wedge . So now decision time for bulls to to take control.
The bulls need to break above the wedge and price must sustain above the wedge .
Trade your levels accordingly.

Arweave (AR) formed bullish Gartley for upto 31.50% moveHi dear friends, hope you are well and welcome to the new trade setup of Arweave (AR) coin with Bitcoin pair
On a daily time frame, AR has formed a bullish Gartley pattern.
Note: Above idea is for educational purpose only. It is advised to diversify and strictly follow the stop loss, and don't get stuck with trade

Arweave (AR) formed bullish Gartley for upto 23.50% pumpHi dear friends, hope you are well and welcome to the new trade setup of Arweave (AR) coin with Bitcoin pair
Previously we had a nice trde of AR:
Now on a 4-hr time frame, AR has formed a bullish Gartley pattern:
Note: Above idea is for educational purpose only. It is advised to diversify and strictly follow the stop loss, and don't get stuck with trade

Arweave Cup & Handle Bullish Breakout (+Targets)We have the same pattern also for Arweave (ARBTC) but we will look at it in the C&H way.
We have the cup and handle pattern with a bullish breakout.
The day that ARBTC went above EMA50 is also the second highest volume day for this pair on this chart.
Signaling buyers pressure (strength).
When a pair is trading above EMA10 we say the short-term potential favors the bulls;
Above EMA50, we say the doors are open for strong growth.
Above EMA200, there can be any type of bullish action, fast, slow, strong but always green...
Additional details on the chart.
Namaste.

Arweave (AR) formed bullish Gartley for upto 25.5% moveHi dear friends, hope you are well and welcome to the new trade setup of Arweave (AR) coin with Bitcoin pair
On a 4-hr time frame, AR has formed bullish Gartley pattern.
Note: Above idea is for educational purpose only. It is advised to diversify and strictly follow the stop loss, and don't get stuck with trade

AR/BTC breakout on 1DAR appears to be breaking out against an important dynamic supply zone against BTC within a broader symmetrical wedge pattern.


ARBTC flagMaybe a another wave higher after making a strong up move. This might be flag could breakout be ready.


Arweave flag breakout!Arweave is a fundamentally great project and since its main source of income is from Solana, It is lagging behind SOL.
Looking at its chart in BTC, It's finally getting out of the flag. Possible target are shown via the arrow.
