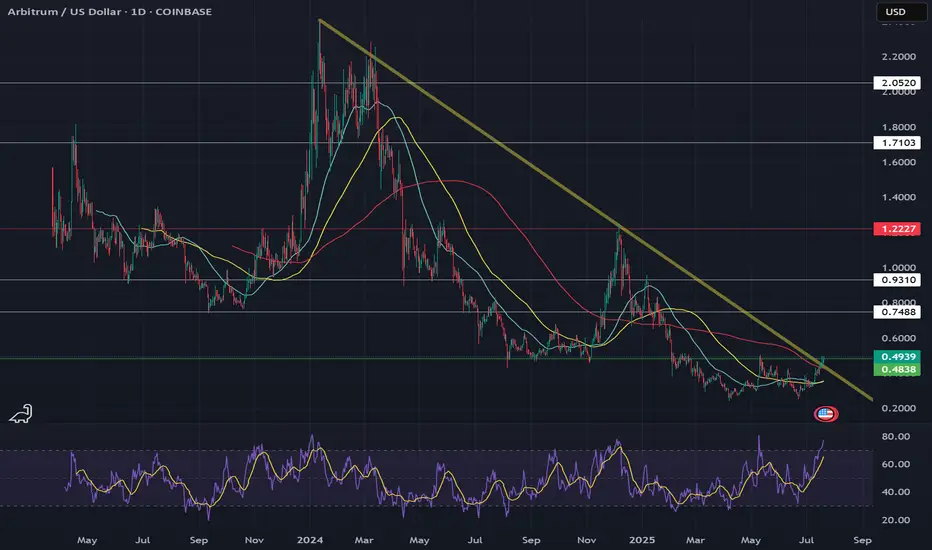
Bullish BreakoutARB/USDT recently showed a breakout above a descending trendline from Jan 24' on the daily timeframe, suggesting bullish momentum. .43 would be a good entry off the 200 MA if we get a back test and if ETH decides to pullback or continue its run to 4000. Arbitrum has officially hits a ATH in stablecoin supply $7,900,000,000. Adoption is in full swing BTC stable I bought a good bit today on robinhood and will buy more up or down. Targets .80, 1, 1.8.
ARBUSD trade ideas
$ARB LONG LOW LEVERAGE PLAY FOR BULL ARB onchain evm will have massive upside potential in the BULL RUN. a REALISTIC number to aim for is a DOLLAR but further insights on how BTC will dominate the Market will give me a more better prediciton once we see BTC test the 150k area. leading it to become a FOR SURE 6 figure asset upon a bear market pullback.
in retrospect. any coin that can pull back 30-40% and still be worth 6 figures in my eyes is for certain a 6 fig asset.
ETH we will look for 2300 to 2700 range for bullish and bearish momentum changes. 2700 breakout would indicate our BULL season has officially began. but it will already be too late!

ARB pump comingAMEX:ARB partners with robinhood NASDAQ:HOOD i expect the pump to continue.. more buys than sells imo
pump to 50c res

ALTS Bullish! Lots of wave 3 Bullish Impulsive patterns forming!This is an update to my past 3 Arbitrum posts. Clear impulsive price action, highest volume, indicative of wave 3s/extended waves. Lots of extensions of subwaves going on in the middle of the sandwich ( 3rd wave of blue wave 3 ), Happy Trading. NOT FINANCIAL ADVICE
"Markets can remain irrational longer than you can remain solvent"
COINBASE:ARBUSD

Update on Arbitrum wave 3 Extension! Bullish!
Update! Subwave 3-3-3 confirmed. Expected continues grinding up as we complete the remaining wave 4,5-4,5 structures. Elliott Waves are so cool 😎

Update on ARB! Bullish Impulse confirmed!ARB according to my Elliott Wave Theory knowledge, is currently grinding up in a bullish impulse. Wave 4 retraced around 38%-50% .618 invalidation looking lonely, just how I like it 👌. Subwave 3 of 3 maybe complete as we seem to be building a triangle structure, indicative of a wave 4. Not financial advice!

Bearish Impulse Complete! Possible zigzag correction in play.Bearish wave 5 of impulse completed the Bearish Trend, now correcting to the upside in a zig zag structure, leg A & B complete, now for wave C im targeting the 1:1 of wave A. We will see if this remains a 3 wave structure, or if it runs into 5 waves it could be an A/W wave of a larger correction. I am still studying Elliott Waves so ahem, this is not financial advice!

ARBIUSD This wave has more upside to giveArbitrum / ARBIUSD is trading inside a Channel Down since the September 11th 2023 low.
At the moment it is on its 3rd bullish wave within this structure and the 1day RSI shows that the breakout above its MA confirms further upside.
Buy and target 0.69000 (+185% like the previous bullish wave).
Follow us, like the idea and leave a comment below!!

easy falling wedge set up for longthis falling wedge pattern is always a great sign. I tend to use it almost exclusively due to how strong they are. seems arb is setting up for a reversal based on rsi and how its comming to the end of the wedge pattern. while better trades may exist this doesnt seem too bad for a 100% gain. not sure if i want to trade it but other may enjoy the info.

Arbitrum (ARB) Price Setup – Will We See a Breakout to $0.50?ARB/USD 4H Chart Analysis – Bullish Reversal Incoming?
Arbitrum (ARB) is showing signs of a potential bullish reversal, with price approaching key resistance levels. Here’s what traders should watch for:
🔥 Key Insights:
✅ Breakout Potential: ARB is testing a crucial horizontal resistance while staying above support.
✅ Major Moving Average (MA): Price is near the 0.3975 MA level, which could act as resistance or a breakout trigger.
✅ Key Targets (Take Profits):
🎯 TP1: $0.4245 – First resistance level.
🎯 TP2: $0.4642 – Strong resistance zone.
🎯 TP3: $0.5001 – Major psychological level.
✅ Support Holding: The $0.3593 zone has acted as strong support, preventing further downside.
📈 Trading Outlook:
A breakout above $0.40 with volume could send ARB toward $0.42-$0.50. If rejected, a retest of the $0.35-$0.36 area may follow before another push.
🚨 Bullish or Bearish?
Current momentum suggests bullish potential, but a confirmed breakout above $0.40 is key for upside continuation.

ARB - Can this troubled project recover?A bit of a bullish retest back to $1.14 for a 135% gain is flashing a possibility.
This one is questionable given the long history of ARB's issues. However recent innovations and renewed developments may boost consumer confidence driving the price up.
It's worth keeping an eye on it.
Developers have introduced a Universal Intent Engine to enhance cross-chain interoperability. This simplifies swaps and transfers, making Arbitrum more accessible. Additionally, Arbitrum has integrated with BitcoinOS (BOS) to leverage Bitcoin’s security. This integration allows Arbitrum One to function as a hybrid rollup, expanding its use cases.
In gaming, Xai Play by Xai Games links Steam achievements to Arbitrum’s blockchain. Players can earn rewards based on achievement rarity, driving engagement. Meanwhile, the ETHDenver Brand Hackathon shapes Ethereum’s branding, further promoting Arbitrum’s ecosystem.

ARB: Vital Support, High Targets.Although #ARB overall technical outlook is not favorable and a bit forced, a bullish scenario is valid as long as it holds above $0.46 (the stop-loss). Breaking it invalidates this idea.
Passing $0.95 confirms going higher, with the first possible target around ~$1.90 (supply zone).
#Arbitrum

ARB - Post Inauguration Chart Arb is not only forming a symmetrical triangle but also forming a bottoming setup on the daily timeframe. It is an ETH related token, so given ETH does well ARB should do really well.
Watch for a break above our black symmetrical triangle (red & green arrows).
We also see that ARB forming a daily doji9 yesterday and is already starting a reversal.
Arb is also holding above the blue 200 MA which is a really bullish signal.

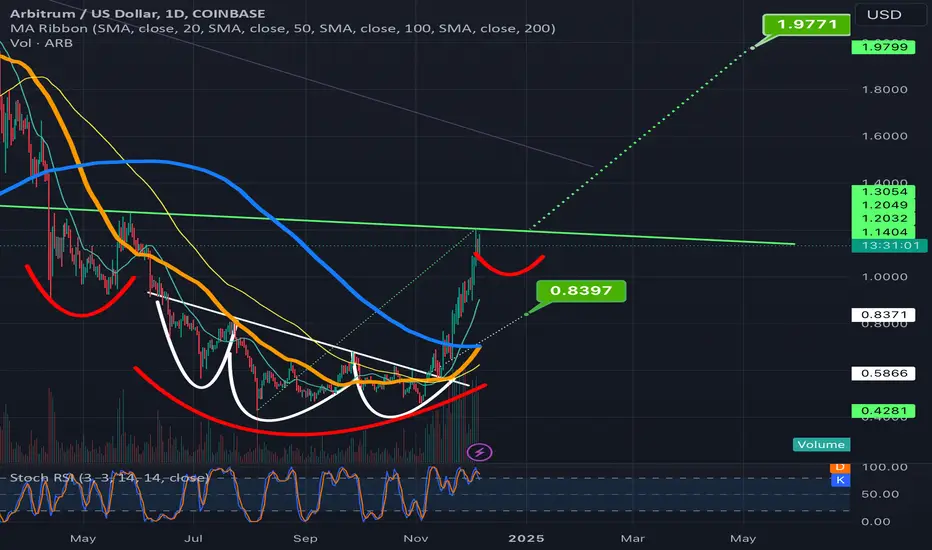
Arbitrum's Reversal Zone: Path to $2?The daily chart for ARB/USD hints at a potential bullish breakout. After testing strong support levels near $0.68-$0.70, the structure suggests a reversal pattern with upside potential toward the $2 mark.
Key observations:
RSI is recovering from oversold territory, signaling bullish momentum.
Critical resistance at $0.7756 could trigger a breakout.
Projection aligns with previous highs, targeting $2 in the medium term.
Is this the beginning of a significant recovery for Arbitrum? Watch closely and share your insights!

ARB breaking up from a bullflag that can take it above necklineArbitrum looks like it has probably founded the lowest depth of the right shoulder of it’s inverse head and shoulders here as it has now broken upward from this purple bullflag here and is now back above the 1 day 50ma(in orange). The breakout target of this flag will take price action above the neckline of the inverse head and shoulders pattern if it hit its full breakout target. We can also see that the bearish h&s that we were under the neckline of for several daily candle closes never progressed into getting validated as is often the case with bearish patterns in this phase of the bull market. I suppose there’s still a chance we could head bck under that light colored tannish neckline again but probability favor the upside at this point. *not financial advice*

Arbitrum | 1D analysis- Arbitrum Daily Timeframe Analysis with Fundamental Analysis
In addition to the pre-launch record of $4 billion in TVL , Arbitrum has a perfect future based on its data and activities !
- After the start and launch of the Arbitrum Nitro update, the price can increase by up to + $50 due to its scalability capabilities as well as the masterpiece architecture of the Nitro blockchain.


Arbitrum: Powering the Future of DeFiArbitrum is a layer-2 scaling solution for Ethereum, designed to significantly increase transaction speed and reduce fees. By leveraging advanced technology, Arbitrum enables developers to build high-performance decentralized applications (dApps) without compromising security.
Why Arbitrum?
Enhanced Scalability : Process more transactions per second, leading to faster and cheaper interactions.
Improved User Experience: Smoother and more efficient dApp usage.
Lower Fees : Reduced transaction costs, making DeFi accessible to a wider audience.
As the demand for scalable and efficient blockchain solutions grows, Arbitrum's potential to become a cornerstone of the decentralized finance ecosystem is immense.

Arbitrum set to goldencross on next daily candle; invh&s in playWe can see after triggering the breakout of the smaller inverse head and shoulders and blowing past that target arbitrum has reached the perfect level that will cause this new inverse head and shoulders to materialize by correcting here and forming a right shoulder. We can also see that Arbitrum is just 1 day away from having it’s daily golden cross and considering many inverse head and boulder patterns in the altcoin market lately have been forming remarkably tiny right shoulders, Arbitrum also could follow suit and break up from the inverse head and shoulder neckline far sooner than you would normally ever expect these kind of patterns to do so. Also a chance it could form a normal shoulder here as well we wll know soon enough *not financial advice*
ARBUSDT100% increase with a target of $2
After several months of decline and increase in digital currencies, this currency is now ready to grow 100% due to strong fundamentals.
Sasha Charkhchian

Which elevator are we taking? ARB finally broke above 1$. With ETH breaking out of the short-term downtrend channel (check my previous post) this ETH-based layer 2 can see some strong gains as long as ETH keeps on moving up. Stronger resistance possible at around 1.4, which would already be a strong move up. If that doesn't stop the price then 2$ and 100% profits may be in sight sooner rather than later!

Arbitrum back to a DollarA distinct W pattern has emerged, leading to a breakout that has been both triggered and retested at the breakout level.
Here are the target levels for this straightforward technical setup for your enjoyment!

ARBIUSD Breaks $0.70 Resistance – Next Stop $1.19?
ARBIUSD is exhibiting strong bullish momentum, characterized by higher highs and higher lows. A recent Change of Character (CHoCH) confirms the shift to an uptrend, as the price has broken the previous resistance at $0.70 and is now trading above the EMA Ribbon, which aligns with the bullish movement.
The price may retrace to $0.70 , a key level within the 50%-61.8% Fibonacci retracement of the latest impulse. This area presents an ideal entry point for buyers, as it aligns with the bullish EMA Ribbon acting as dynamic support.
If the bullish trend continues, and the price rebounds above the EMA Ribbon or from the $0.70 level, the next significant target is projected at $1.19 . This level represents the next resistance zone, marking a potential upside continuation.
The TSI indicator supports the bullish outlook, showing a previous bullish divergence followed by a breakout above the zero level and its moving average, signaling upward momentum. Furthermore, the Signal Builder has recently confirmed bullish signals in alignment with these factors.
👨🏻💻💭 Are you taking advantage of this bullish breakout? Share your thoughts below!
_________________________________________________________________
The information and publications within the 3Commas TradingView account are not meant to be and do not constitute financial, investment, trading, or other types of advice or recommendations supplied or endorsed by 3Commas and any of the parties acting on behalf of 3Commas, including its employees, contractors, ambassadors, etc.
