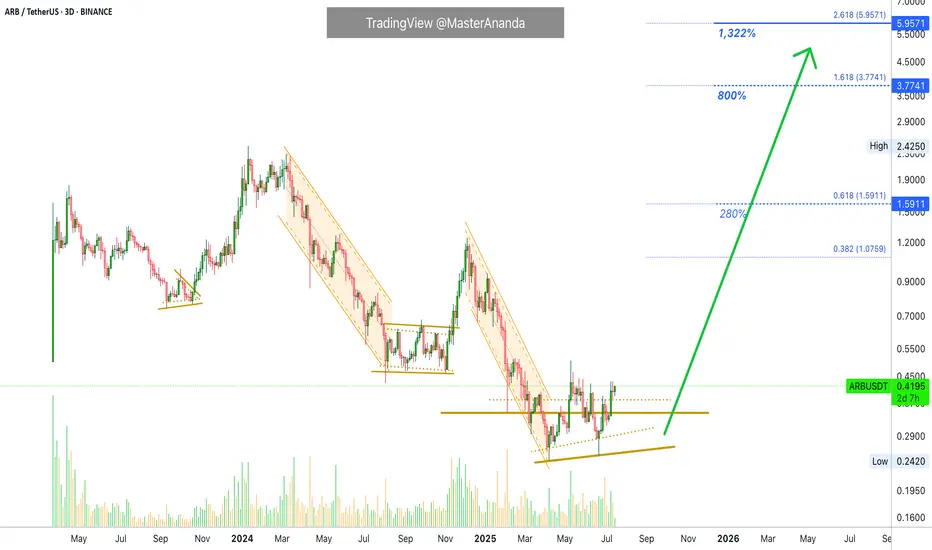
Arbitrum 1,322% Profits Potential · Easy · Crypto is Going Up!This will be intense, truly intense. Arbitrum will perform one of the strongest bullish waves in the entire market. Just one red session and we are back up, back green and ready to move. It will be huge.
This is a big project and yet, we have a standard, easy target, around 1,322%. Such huge potent
Multiple Nested Wave 3s on Arbitrum! Super Bullish!!🧙♂️I have an Elliott Wave count to share with you showing a super bullish Triple 1,2 in the 3rd wave of the Red impulse playing out. Meanwhile, we are currently in the third wave of the 5th wave of the Blue impulse, which contains in itself more nested waves in the form of a triple 1,2. Chart is sh

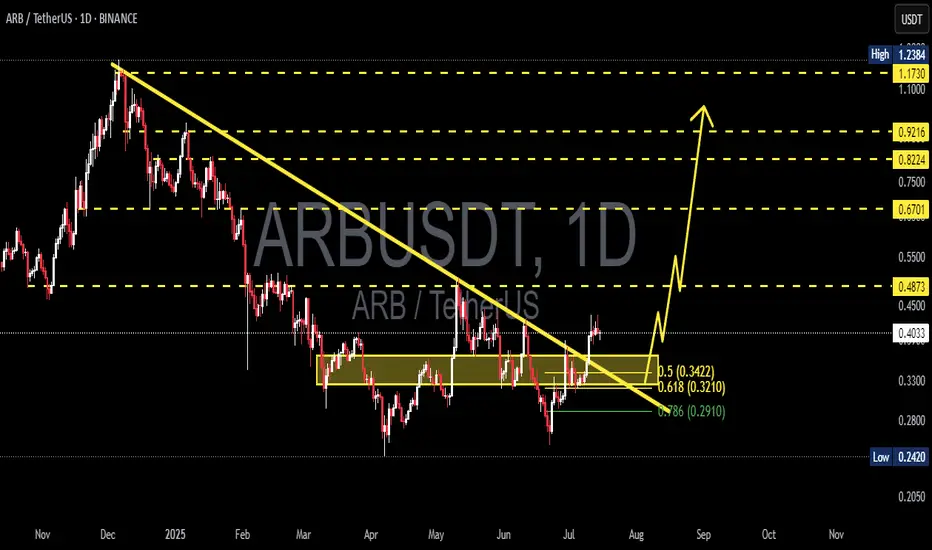
ARB/USDT Breaks Downtrend – Major Bullish Reversal in Play!📊 Technical Analysis (Daily Timeframe)
ARB has officially broken out of a long-standing descending trendline that has defined its downtrend since late 2024. This breakout, supported by strong demand at key Fibonacci levels, could be the start of a major bullish reversal.
🧠 Key Chart Patterns & St
Arbitrum (ARB): Looking For Breakout & Fill of 2 Bullish CMEsARB coin looks good, as the price is slowly approaching the major resistance area where we are going to look for a breakout. As soon as we get the breakout, we are going to aim for the fill of both bullish CMEs, which will give us a good long opportunity there.
Meanwhile, catching smaller scalps t

Arbitrum scalp long to $0.4224Just hopped into arbitrum scalp long.
Stop: $0.4088
Tp: $0.4224
Roughly 2 RR

ARB 5X SoonArbitrum
Arbitrum is an EVM-compatible optimistic rollup blockchain platform built on top of Ethereum.
Everything is clear on the chart.
It's time to fly.
I wish everyone abundant profits.
Like and follow
for more.

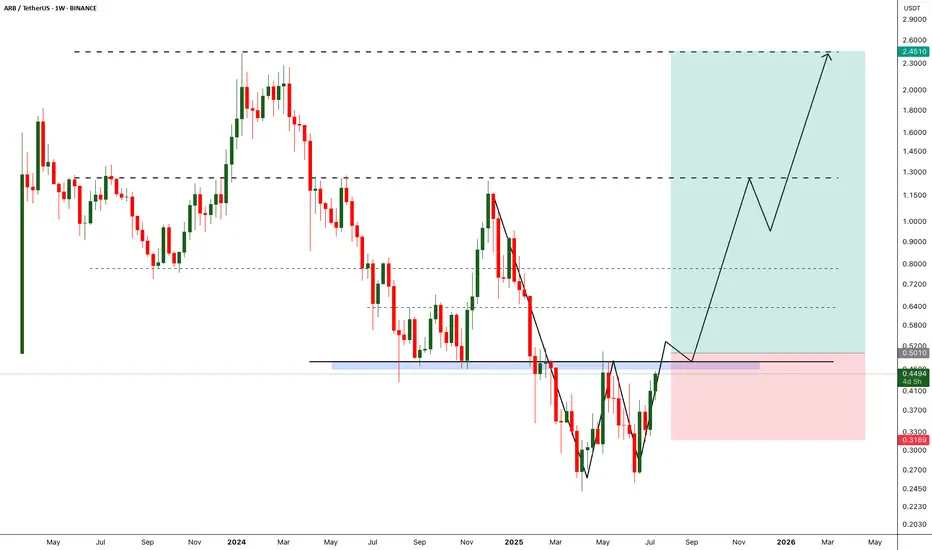
ARB - Breakout will break the market- Arbitrum is one of the fundamentally strong token on ETH L2.
- After back to back crashes finally we are seeing some reversal from the bottom
- A breakout from the local resistance would push the arb price further, we need to wait till the breakout to enter the trade.
Entry Price: 0.5010 (after
Altcoin Season loading?Arbitrum has broken out of the descending wedge, reclaimed the POC and is headed to higher levels. We went long at the breakout and stop loss has been placed at break even.
Not financial advice, do what’s best for you

ARB/USDT Analysis – Potential Breakout Ahead?📅 Timeframe: 1D
💰 Current Price: $0.3559 (+5.33%)
📊 Volume Spike: 389.18M
ARB is currently testing a descending trendline resistance that's been respected since mid-May. Price action has formed a base around the $0.35 level and is now showing signs of strength with a recent bullish candle.
📈 Key L

Perfect Short Setup? ARB Enters Bear TerritoryARB/USDT on the 4-hour chart is trading right into a proven resistance zone between 0.4266 and 0.4448 USDT, where the price has reversed multiple times before, as shown by the red “S” markers. This level acted as a ceiling during prior rallies, triggering sharp declines each time it was tested.
The

See all ideas
Summarizing what the indicators are suggesting.
Oscillators
Neutral
SellBuy
Strong sellStrong buy
Strong sellSellNeutralBuyStrong buy
Oscillators
Neutral
SellBuy
Strong sellStrong buy
Strong sellSellNeutralBuyStrong buy
Summary
Neutral
SellBuy
Strong sellStrong buy
Strong sellSellNeutralBuyStrong buy
Summary
Neutral
SellBuy
Strong sellStrong buy
Strong sellSellNeutralBuyStrong buy
Summary
Neutral
SellBuy
Strong sellStrong buy
Strong sellSellNeutralBuyStrong buy
Moving Averages
Neutral
SellBuy
Strong sellStrong buy
Strong sellSellNeutralBuyStrong buy
Moving Averages
Neutral
SellBuy
Strong sellStrong buy
Strong sellSellNeutralBuyStrong buy
Displays a symbol's price movements over previous years to identify recurring trends.