Arbitrum analysis ●If ARB got daily closing below 1.0652 then we might see ARB going down towards 0.9448 level
●At current ARB is trading at the Daily FVG...if btc started to pump or consolidated at the current levels then we might se ARB pump towards 1.2246 and 1.3499 levels
●At current ARB is trading near the midpoint of the weekly FVG which should support the price for pump
ARBUSDT trade ideas

ARB/USDTAlready broken up big down trendline and create new higher high and higher low.
price already touch discount price and move up, we will see the price more higher soon

ARB/USDT GOING FOR UPWARD MOVEArb is going to be bullish.
just touched our entry zone.
just for knowledge perspective.

📊#ARB will continue to rise based on the smiley structure📈We consolidated for a period of time after completing the short target, and finally formed a smiling face bullish structure. After breaking through the turning point, the smiling face bullish structure was established. At present, we have completed target 1 and encountered resistance in the resistance zone. After a period of pullback, there should be a lot of good performance. 🙏
⚠️Note, if our long defense point is broken then this bullish idea will be invalidated, there is risk in any trade, so don’t forget risk management. 💯✔️
🤜If you like my analysis, please like 💖 and share 💬
💕 Follow me so you don't miss out on any signals and analyze 💯

ARB According to my personal opinion, it is expected that we are now in an impulse wave 3, confirmation that wave 1 has been breached

ARBUSDTI think the area of 1.230 is very important. As long as the area is not broken, this currency can be corrected.

📈📊 #ChartPattern Alert! 📈📊 📈 Channel 📈A "channel," in the context of trading and technical analysis, is a chart pattern that forms when the prices of a financial asset move between two parallel lines, creating a kind of corridor or channel. There are two main types of channels: an ascending channel and a descending channel.
Ascending Channel: This channel forms when prices have an overall upward trend, but this trend is contained within two upward-sloping parallel lines. The lower level is the support, where prices often find buyers, while the upper level is the resistance, where sellers may come into play. Traders often view the ascending channel as a sign of the continuation of the existing uptrend.
Descending Channel: On the other hand, the descending channel forms when prices have a downward trend, but this trend is bounded by two downward-sloping parallel lines. The upper level is the resistance, where prices tend to retreat, while the lower level is the support, where minor bounces may occur. Traders typically interpret the descending channel as a sign of the continuation of the downtrend.
Channel analysis is an important tool for traders as it can help identify entry and exit points, as well as set profit targets and stop-loss levels. However, it's crucial to note that channels are not foolproof, and prices can break beyond the channel lines, signaling a change in trend.
In summary, a "channel" is a chart formation that depicts the direction and strength of a price trend in a financial asset. It's a useful tool for traders looking to make informed decisions about their market trades.

#ARB Looking goodChart is pretty much self explanatory.. Price action looks clean, maintaining a key level on weekly.
Keep it simple, trade levels.

ARB is gearing up for a major pump - 25% loading! 🚀 Get ready, crypto enthusiasts! 📈 ARB is gearing up for a major pump - 25% loading! 🌐 Exciting times ahead as the market heats up. 🔥 Are you prepared to seize the opportunity? 🚀💹 #ARBPump #CryptoNews #TradingAlert #BullishVibes 🌟📊

Exciting developments in the $ARB 🚀 Exciting developments in the AMEX:ARB universe! 📈 The charts are painting a promising picture with a Bullish Falling Wedge breakout and a robust Double Bottom formation. 🔄 The technicals suggest a potential upward surge, and I'm gearing up for the ride!
📊 Currently loading up as we speak, eyeing a target of $1.8. 🎯 This setup seems to have the perfect recipe for significant gains. 🚀💰 The market sentiment is positive, and I'm ready to capitalize on this opportunity!
🌐 Keep an eye on the charts, fellow crypto enthusiasts! 📈 Let's ride the waves together and aim for those impressive gains. 🚀💎 #ARB #CryptoNews #BullishSetup #DoubleBottom #ToTheMoon #CryptoTrading #MarketWatch 🌕

#ARB/USDT reclaim the PMH $0.9985 as a support in 1-Hour TF!#ARB/USDT reclaim the PMH $0.9985 as a support in 1-Hour TF!
Wait for Trendline breakout to open a Long position. AMEX:ARB needs to clear the Trendline to gain the bullish momentum.

ARB - come to low renge❤️❤️Thanks for boosting 🚀 and supporting us!
📈low trading renge + break trendline .
📊 (Buy) : 0.0103 $
🔴 Stop Loss : 0.9535 $
🎯 Take Profit : 1.0730 - 1.1447 $
🔗 For more communication with us, send a message in TradingView.


ARB(ARBUSDT): BUYING OPPORTUNITY ↪️ARB is engaged in Elliott wave surge following the formation of a twin base pattern on a daily timeframe. Analyzing from a 4H TF I spotted a bearish flag which suggest further downward move to the daily horizontal support.
Following a prolonged 5-wave surge, the ABC adjustment has commenced. Currently, the motion is in wave 3, and I anticipate its conclusion in wave 4. It is in this range that I will acquire extended positions...Tarde safely 👍✅

H&S like most ALTS?Arb looks like its retesting the head and shoulder breakdown. If this plays out it'll dump it back into its downward channel, making this a deviation.
Targets then would be 0.80c and under 0.60c if BTC really dumps

ARB $1.35The key price of ARB is $1.35, which will be a good price to Take Profit.
Meanwhile USDT.D is currently at 6.3%, which i think the bottom is 6% in the previous idea.
Trade safely.

ARB - Heading Down To Print an Inverted Head & Shoulders PatternSome alts are now collapsing with bearish momentum candles and it was now a profitable decision to partially sell.
As we looked at before with the Resistance and Demand Line both providing liquidity pockets, this was an ideal setup for price movers to push up into the double pocket, trigger lots of stop losses and limit buys, then move back down.
And that is exactly what has happened and a Shakeout Reversal Pattern was formed; creating the Right Shoulder of a Head & Shoulders pattern and now ARB is dumping with a second bearish momentum candle printing.
We'll have to see where this candle closes, but if you look at the size of the current and previous candle, they are a fairly equal opposite compared to anything in the uptrend.
For that reason I think this may be a deeper correction here.
And so ARB will soon be hitting some supports if it continues down but I think this looks like it may get all the way back to re-test Left Shoulder Support and print a symmetrical Inverted Head & Shoulder patter as we looked at before and then if it gets there is will have a good chance to hit the 0.618 of the retracement Golden Window 🧐.
Not advice

ARBUSDT LONGARBUSDT, a chart/ reversal pattern on weekly timeframe
which indicate this pair might rally to the upside
double bottom
neckline has been broken
currently retesting the broken neckline
expecting a bullish on ARBUSDT

ARB/USDT Ready for an Explosive Journey? ARB Daily Analysis💎Yello, Paradisers take note as ARBUSDT displays a striking scenario at its resistance point, indicating a potential bullish departure from the Bullish Order Block (OB).
💎Arbitrum has recently pierced through its descending trendline, suggesting a climb is underway. It's currently facing a challenge at the 1.2624 resistance, yet the prospects for a bullish push originating from the Bullish OB are promising.
💎An additional bullish sign is ARBUSDT's sustained strength above the EMA100, adding weight to the optimistic scenario.
💎Nonetheless, traders should remain alert: a fall beneath the 0.940 level may signal a shift to bearish territory. Keep a close watch and strategize with prudence.
💎Refine your trading decisions for ARB with ParadiseFamilyVIP. Delve into our expert analyses on ARB and other potential tokens, refining your crypto approach.

ARB Buy Limit 😎♻️😎♻️😎Hi dear traders
ARB has formed bullish flag.
If breakout correctly, we can open long position with suitable stop-loss.
Let's see what happens
This is not financial advice ( DYOR )
Good luck

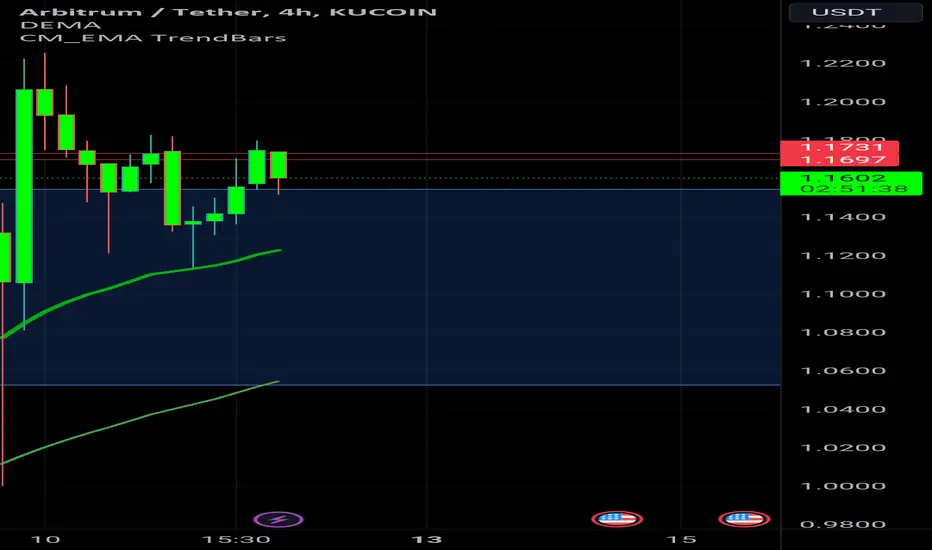
personal opinionBy breaking the resistance zone, which is the blue box, and touching the number 1.18, he was able to return to the broken resistance, with a little energy, he is preparing to continue the upward trend.
ARB/USDT - Bulls in Command! 🚀**
Dear Traders,
Bulls are firmly in control of ARB/USDT. Anticipating a further price increase, potentially reaching 30-50% soon. The recent pump from a double bottom suggests a move to capture all the upper liquidity.
Note: This is a personal opinion, not financial advice. Conduct your own research before making any decisions.* 🌐💹

ARB Double bottom reversal in progressLooking at the chart its easy to spot. Blackrock confident in an ETF approval, lots of other alts looking similar, it's hard not to be bullish, but keep the feet on the ground for now.
