📈 ARB: 2-Day Double Bottom - Descending Triangle 🚨 Attention traders, we've got an exciting chart setup on ARB! A 2-day double bottom pattern is forming, with a descending triangle on the horizon. It's time to craft a trading plan for potential breakouts.
Chart Analysis:
Pair: ARB
Timeframe: 2-Day
Key Observations:
Double Bottom: The ARB chart shows a clear double bottom pattern, indicating a potential reversal. 📉📈
Descending Triangle: A descending triangle has formed, suggesting a period of consolidation. 📉🔼
Support and Resistance: The recent double bottom acts as a significant support level. We aim for an upside breakout with resistance at the All-Time High (ATH) around $2. 📊🧩
Trading Plan:
Entry: Consider entering a long position when the price breaks above the upper boundary of the descending triangle. Ensure this breakout is confirmed with strong volume. 🚀📊
Stop Loss: Set a stop loss just below the support level of the double bottom pattern to manage risk effectively. 🛡️⛔
Take Profit Targets:
First Target: Around $2, which is the ATH. This level could act as resistance, so consider taking some profits here. 💰💼
Second Target: Beyond ATH, consider letting a portion of your position run in case of a price discovery phase. 🎯📈
Price Discovery Targets:
In a bullish scenario where ARB experiences price discovery, we could see the price surge toward $20. This is a speculative but exciting target, and you may consider trailing your stop loss to protect gains.
Risk Management:
As with any crypto trade, remember that the market is volatile. Only invest what you can afford to lose and employ proper risk management strategies, including setting stop-loss orders.
Disclaimer: This is not financial advice. Always do your research and consider consulting with a financial advisor before making any trading decisions.
Keep a close eye on ARB as it approaches the apex of the descending triangle. Potential breakouts could be just around the corner. Happy trading, and may the markets be in your favor! 🚀💹
Note: TradingView posts are for educational and informational purposes only. Always conduct your research and use proper risk management when trading cryptocurrencies. 📚🔍
ARBUSDT trade ideas

ARBITRUM MAJOR BREAKOUT INCOMING!!
Lets take a moment to look at this beautiful chart and see the opportunity that lies in front of us. I can see a major breakout incoming with this project. People need to realize that this has one of the most active networks in the entire crypto ecosystem. #2 to be exact behind ETH. Once this project start to pump, it will really pump.
Personally I will be DCA-ing this project leading up to the next bull run. If all goes as planned, I will be a happy camper.
Calculate Your Risk/Reward so you don't lose more than 1% of your account per trade.
Every day the charts provide new information. You have to adjust or get REKT.
Love it or hate it, hit that thumbs up and share your thoughts below!
This is not financial advice. This is for educational purposes only.

ARB bottom 0.3~0.41D time frame
-
ARB performing weak trend since making ATH 1.82 which was hit on 18th April this year. Considering the potential further dump of market, I use 1.13 Fibonacci Expansion to evaluate the appropriate price to buy spot, which range is 0.3~0.4. We could see ARB show this price by December, then it would be a sweet time to accumulate ARB spot before bull.

ARB/USDT
Huge falling wedge pattern, I have labeled resistance and support, and another support as a blue line which I am hoping for it to bounce, unfortunately if it does not bounce and invalidate the head and shoulders pattern that means it will play out with a target of $0.58

ARB │ 19.10.2023BINANCE:ARBUSDT.P
Signals for level breakout
bar/candles closure near the level;
bar/candles closure near its high/low;
close retest of the level;
accumulation of energy for level breakout;
consolidation near the level;
decrease in trading volumes before the level;
a clear zone beyond the level;
no response to a false level breakout;
the instrument is being held from falling/rising in price;
there is a reserve of calculated ATR;
there is a reserve of technical ATR;
Trade Parameters
Open : 0.7750636;
Stop loss : 0.7787456;
Take profit :
0.7640176;
0.7603356;
0.7566536;
Disclaimer
Every trader should make their trading decisions based on their own analysis and circumstances. The signals in this channel should be considered as an additional tool for your own consideration.
Follow me and receive high-quality cryptocurrency market analysis!

ARB on a potential bearish wave...soonARB on a potential bearish wave...soon
ARBITRUM is in a clear bearish wave from the top and it is not taking a pause.
It looks like this Altcoin is only releasing liquidity and all the bullish moves
are offering another opportunity to sell again.
Price broke out from the pattern and it can move down further again.
Targets:
🎯 0.748
🎯 0.706
🎯 0.678
Thank you and Good Luck!

ARB now can be down upto 1$Maximum holders will book profit now at this strong resistance, As you can see RSI bearish divergence, higher high in price and lower high in RSI, which can lead to a trend reversal and price dumping upto 1$, if it maintain this channel, not a financial advice, trade at your own analysis

🔥 Arbitrum's Short Looks Great: Patience For Reversal!At the start of the month I was looking for a short entry on ARB, which has been playing out great thus far. However, with ARB losing value rapidly, I'm starting to look for long opportunities.
ARB is trading in a very well-defined bearish channel (or wedge). My strategy is to wait for the price to touch the bottom support. Ideally, the daily RSI will be below 30 to increase the reversal probability.
Until then, the short stays active. Patience is key.

Are we bullish on Arbitrums ARB ?I think rollups are going to play an increasingly bigger role come bull market
The archaic way ethereum has been used in previous bull markets demands a solution. A solution roll ups is likely to play on a large scale. Having third parties rollup microtransactions in order to ease pressure on the main ethereum blockchain is something that will encourage wider spread use of ethereum and crypto products. Paying $100 in fees for a $9 nft isnt a sustainable offering.
ARB is in a big falling wedge
This wedge doesnt need to play out according to textbooks and can easily be counter traded and fail. With that in mind tho.. being able to capture good low risk entries in this potentially bullish pattern leading into 2024 can end up being extremely beneficial.
Keep an eye out for changing data
Data on this can change quickly and importantly so its crucial to say nimble and on your toes to new information.

ARB Bearish Pattern 😎🔻😎🔻😎🔻Hi dear traders
As you saw in the previous analysis, we reached the full goals.
The price reached the midline of the descending channel and we took full profit
Now the price has broken the midline of the channel and this is a false break
A bearish pattern is formed near psychological resistance 1$
If confirmed, we can enter the selling position
Let's see what happens
This is not financial advice ( DYOR )
Good luck

ARB Looking bearishARB broke down from the 4hrs TF trendline and now on support... Wait for bearish retest of the imbalance at 0.8367 or wait for 4hrs candle to close below 0.7972
Follow for more market update

ARB shortARB broke trough the ascending trendline. Asset broke trough the support level. Bearish movement to support level at 0.742 is possible.

ArbusdtObv and price divergence is nearing confirmation here..
My guess would be after retesting the breakout line we make a move for the upper downtrend line from here ~25% move
Let's see how it plays out

ARB Trade Idea ft. HarmonicsIt bounced from the demand zone and holding well.
Rsi is also in oversold region.
TP: Green Levels.
Sl: Use accordingly
NFA DYOR

ARB has reached the point of considering buyingARB has reached the point of considering buying.
After pumping 30% around the end of September
ARB has returned to the market price level to start pumping.
At this price, we have an opportunity to consider buying.
At the price level of 0.8, there was quite a strong reaction from the bulls.
Now we just need to wait for a short profit-taking session of buyers below 0.8 to buy.

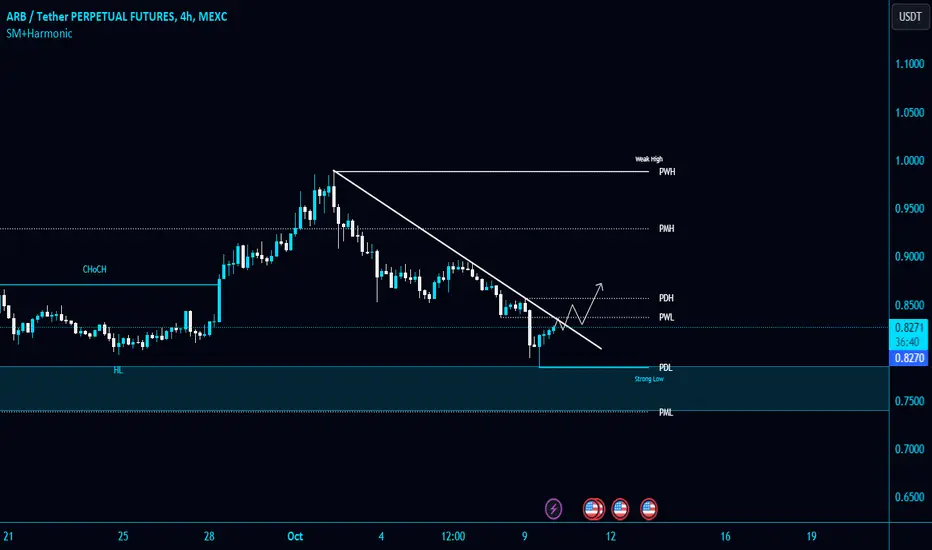
#ARB/USDT is testing the Diagonal Trendline and PWL $0.837 resis#ARB/USDT is testing the Diagonal Trendline and PWL $0.837 resistance level in 4-Hour TF!
AMEX:ARB needs to reclaim PWL as a support to gain bullish momentum.
Wait for reclaim and breakout to open a long position. In case of rejection, it will retest PML strong support.
ARB - Long ( 09 Oct - 15 Oct )Good luck to everyone! This analysis is for educational purposes only and does not constitute financial advice. Conduct your own analysis before making trading decisions.

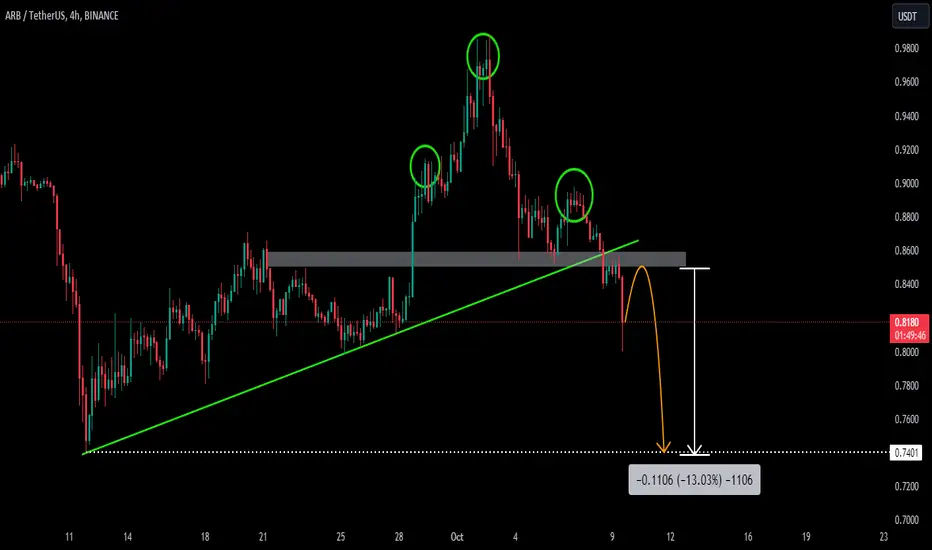
ARBUSDTARBUSDT is trading in bullish parallel channel, and created Head and Shoulder pattern at strong resistance area. And a massive sell rally break the neckline of HnS pattern. any successful retest of broken level will be nice option to sell.
if the sell pressure continues, the next target could be the back to lows at 0.7400 region.

ARB CLEAN CHART Here you can see one of the cleanest charts currently. I think the buy zone is pretty clear, let's hope it arrives!

ARBUSDT short idea h4HI guys. What do you think about ARBUSDT ? According to the formation of divergence and price action lines, I see a downward trend of H4 and then an upward trend.

Arbitrum ARB longLong Arbitrum!
It looks like ARB are on a move upwards. I see a potential 30-50% profit trade.
You can either wait for ARB to break the long downward trend (and buy the retest) or start buying at 0.85 (trendline/support ).
The risk/reward looks good, even with a solid stop loss.
For me this is a good spot trade - no leverage - no financial advice!

Arbitrum longArbitrum bounced off the ascending trendline and bounced off the support level. Bullish movement to resistance level at 0.9715 is expected to happen.
