ARB Looking bearishARB broke down from the 4hrs TF trendline and now on support... Wait for bearish retest of the imbalance at 0.8367 or wait for 4hrs candle to close below 0.7972
Follow for more market update
ARBUSDT trade ideas

ARB shortARB broke trough the ascending trendline. Asset broke trough the support level. Bearish movement to support level at 0.742 is possible.

ArbusdtObv and price divergence is nearing confirmation here..
My guess would be after retesting the breakout line we make a move for the upper downtrend line from here ~25% move
Let's see how it plays out

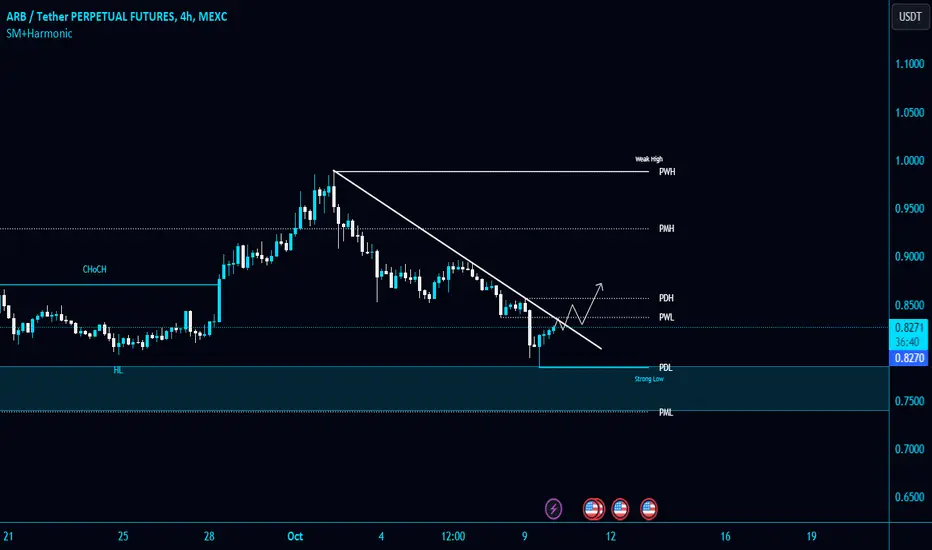
ARB Trade Idea ft. HarmonicsIt bounced from the demand zone and holding well.
Rsi is also in oversold region.
TP: Green Levels.
Sl: Use accordingly
NFA DYOR

ARB has reached the point of considering buyingARB has reached the point of considering buying.
After pumping 30% around the end of September
ARB has returned to the market price level to start pumping.
At this price, we have an opportunity to consider buying.
At the price level of 0.8, there was quite a strong reaction from the bulls.
Now we just need to wait for a short profit-taking session of buyers below 0.8 to buy.

#ARB/USDT is testing the Diagonal Trendline and PWL $0.837 resis#ARB/USDT is testing the Diagonal Trendline and PWL $0.837 resistance level in 4-Hour TF!
AMEX:ARB needs to reclaim PWL as a support to gain bullish momentum.
Wait for reclaim and breakout to open a long position. In case of rejection, it will retest PML strong support.
ARB - Long ( 09 Oct - 15 Oct )Good luck to everyone! This analysis is for educational purposes only and does not constitute financial advice. Conduct your own analysis before making trading decisions.

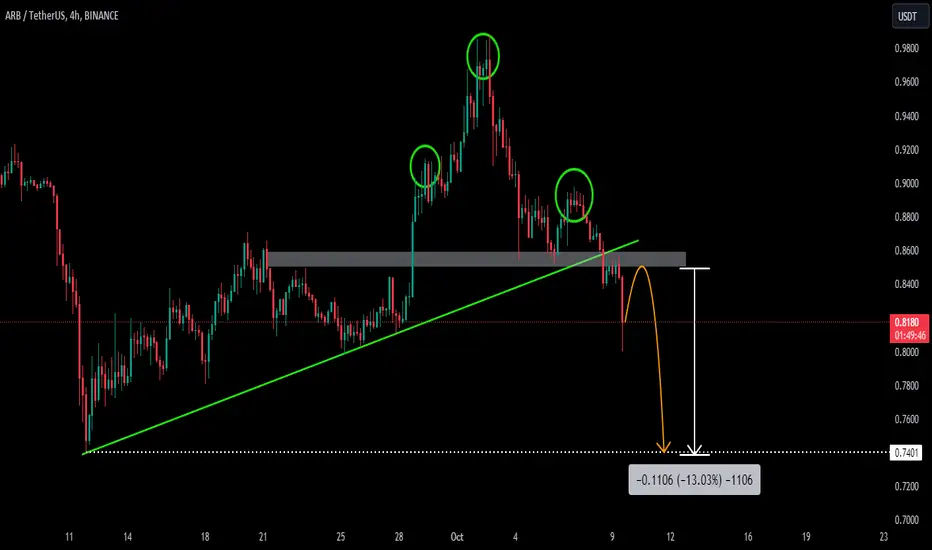
ARBUSDTARBUSDT is trading in bullish parallel channel, and created Head and Shoulder pattern at strong resistance area. And a massive sell rally break the neckline of HnS pattern. any successful retest of broken level will be nice option to sell.
if the sell pressure continues, the next target could be the back to lows at 0.7400 region.

ARB CLEAN CHART Here you can see one of the cleanest charts currently. I think the buy zone is pretty clear, let's hope it arrives!

ARBUSDT short idea h4HI guys. What do you think about ARBUSDT ? According to the formation of divergence and price action lines, I see a downward trend of H4 and then an upward trend.

Arbitrum ARB longLong Arbitrum!
It looks like ARB are on a move upwards. I see a potential 30-50% profit trade.
You can either wait for ARB to break the long downward trend (and buy the retest) or start buying at 0.85 (trendline/support ).
The risk/reward looks good, even with a solid stop loss.
For me this is a good spot trade - no leverage - no financial advice!

Arbitrum longArbitrum bounced off the ascending trendline and bounced off the support level. Bullish movement to resistance level at 0.9715 is expected to happen.


ARBUSDT short and long idea 15mHello TRADERS. What do you think about ARBUSDT ? According to the formation of divergence and price action lines, I see a downward trend of 15 minutes and then an upward trend.

ARB/USDT | 1d 👀Time to fall deep?
ARB has been trading in a bearish channel for a couple of months. The coin is currently positioned within a supply zone, suggesting a potential bearish downturn. It has broken out of an ascending channel and moved into a previous demand zone. Be prepared for potential gains in this scenario.
✅ Stay updated on market news and developments that may influence the price of Arbitrum. Positive or negative news can significantly impact the cryptocurrency's value.
✅ Exercise patience and discipline when executing your trading plan. Avoid making impulsive decisions driven by emotions, and adhere to your strategy even during periods of market volatility.
✅ Remember that trading always involves risk, and there are no guarantees of profit. Conduct thorough research, analyze market conditions, and be prepared for various scenarios. Trade only with funds you can afford to lose and avoid excessive risk-taking.
#Crypto #Coins #Arbitrum #Trading #ARB

Plan for ARBLooks like ARB has found its bottom,
And here is the AMEX:ARB sailing plan for you when the arb is adjusting.

ARBUSDT Elliott Waves AnalysisHello friends.
Please support my work by clicking the LIKE button👍(If you liked). Also i will appreciate for ur activity. Thank you!
Everything on the chart.
Target/reversal zone: 0.6 - 0.5$
after first target reached move ur stop to breakeven
Stop: (depending of ur risk). ALWAYS follow ur RM .
risk is justified
Good luck everyone!
Follow me on TRADINGView, if you don't want to miss my next analysis or signals.
It's not financial advice.
Dont Forget, always make your own research before to trade my ideas!
Open to any questions and suggestions

ARB/USDT bullish ride? 👀 🚀 Arbitrum today analysis💎 Paradisers, turn your attention to #ARBUSDT as we've spotted it making intriguing moves, currently trading within a demand zone and gearing up for a bullish surge.
💎 A look back reveals that #Arbitrum broke out of its descending channel, embarking on an upward trajectory. Adding to this, a recent shift has been noted where a previous supply zone has transformed into a demand zone. This transition hints at a likely bullish continuation from this very demand zone.
💎 Another angle to keep in mind: if the price of #ARB breaks below this demand zone, it might descend to its previous low. And if it breaches that previous low as well, a continued downtrend could be on the horizon. In both scenarios, trade with caution and strategy.
💎 Remember to employ prudent trading strategies and use proper stop-loss measures! Stay alert to market movements and look forward to more insights!

🔥 Arbitrum Approaching Key Resistance: Bears Are Ready!ARB has been trading inside this bearish channel for a couple of months now. I'm expecting the top resistance to hold yet again, making it a great area for a potential short entry.
Ideally, we wait for the RSI to be overbought on the daily and make an entry around the key area of 1$.

ARB Buy Limit 😎✅😎✅😎✅Hi dear traders
The price is moving in the descending channel.
Due to the oversold in the 4H timeframe, we expect the price to rise from the indicated area to the middle line of the channel.
Let's see what happens
This is not financial advice ( DYOR )
Good luck

ARB looking to retrace a bit before continuationARB looking to retrace a bit before continuation.
The last push up has left a bit of a gap, and currently price is cooling off.
Likely price will return to the gap, 0.382 for a bullish bounce. If it falls through that, there is support at the 0.5 fib level.

$ARB Update AMEX:ARB - I'm playing TA here and see this one getting a decent amount of volume again. Spot positions should do well over the next month.
