ARBUSDT D1Dar time rozane gheymat olgooye konj tashkil dade k az ghaza rooye yek naahiye hemayat hast .
ARBUSDT trade ideas


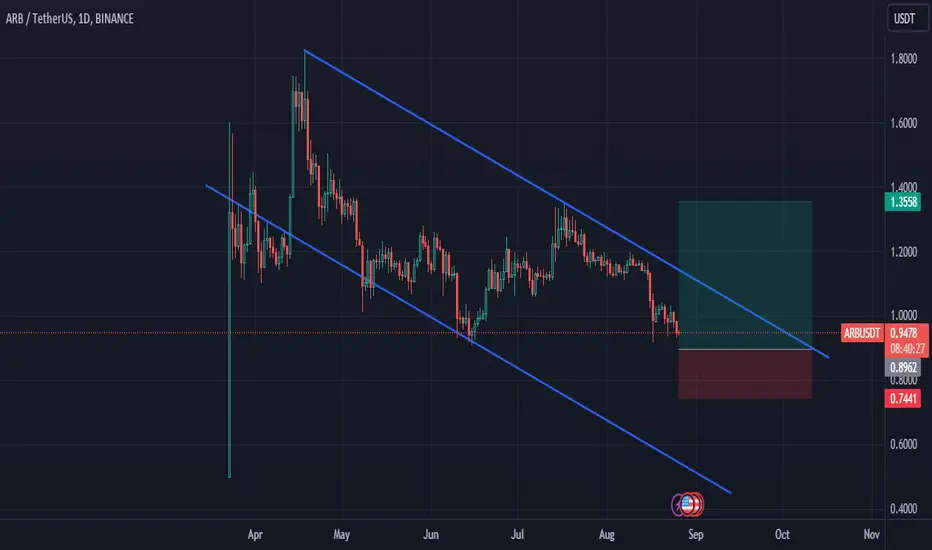
$arbInvalidation below blue line
flip blue line and continue
hopped on a few minutes ago so may come back if you want better r/r

long ARBAMEX:ARB broke through the resistance level. Bullish movement to $1.04 is expected to happen.

$ARB LONGBINANCE:ARBUSDT LONG
HTF horizontal support (double bottom) & multiple bullish divergences on 4h building up.
I am using smaller leverage and position size since the stop loss is wide.

Brief Analysis——ARBARB has fallen near the lows of June recently. Offchain Lab once again repurchased ARB worth $1.7 million, but it did not boost the market's confidence on ARB. Also as the leading L2, OP has become a super chain with its OP stack, and its performance within the month surpassed most tokens. The attention paid on ARB gradually decreased.
When it was first listed, ARB ushered in a round of rise, but the selling pressure of the airdrop quickly pulled the price down. Since May, ARB has remained fluctuating in the yellow range. The upper rail of the range is the support level of the accumulation area in April. Although the price briefly broke through the upper rail, it quickly returned to it.
The ARB started moving down in mid-July, with little bull reinforcement seen in the process. The bears intensified again on August 16, and the price quickly came near the lows. In the last week, although there were some green candles, the length of the green candle was very and was covered by the red candle. After that, ARB began to fall with fluctuation. The bears are always in control.
Conclusion: Mostly falling. ARB remains neutral on a large scale. The bulls are not strengthening near the lows. So we come to this conclusion. We set resistance level at 1.0655 and support level at 0.9075.
Disclaimer: Nothing in the script constitutes investment advice. The script objectively expounded the market situation and should not be construed as an offer to sell or an invitation to buy any cryptocurrencies.
Any decisions made based on the information contained in the script are your sole responsibility. Any investments made or to be made shall be with your independent analyses based on your financial situation and objectives.


🔥 ARBITRUM Bearish Support Break OutAs of yesterday, ARB has fallen through a strong area of support which held the bull trend going for over a month. In my view, there's a high possibility that ARB will continue to fall, potentially even retesting the June lows around 0.92
ARB is quite oversold at the moment, so we're going to anticipate a bullish correction towards 1.19 or so. Stop just above 1.21 for an optimal risk-reward ratio. A more risk-averse trade would be to take (partial) profits around 1$.

Given the current conditions, it is expected to growAccording to the existing conditions and the potential that I see, it is expected to grow
ARBITRUM $ARB FALLING WEDGEAMEX:ARB broke out of falling wedge to find resistance around 1.28
Currently arbitrum price action has found support around 1.15.
#arb needs to remain supported at 1.15 to try for higher
resistances: 1.28, 1.43, 1.56, 1.69, 1.81
Else a retest of 0.92 is inevitable!
Current Price: 1.20

$ARB LONGBullish divergence on 4h with oversold RSI. Previous bull divs provided an at least 5% impulse so i'm expecting a similar action now.

ARB HAS A POTENTIAL TO 1.3$NFA!
AMEX:ARB It looks like the uptrend is coming.
1.06$ is an important support

ARB Buy TradeHere is my Study on ARB..
Welcome to my channel! Here you'll find daily technical analysis ofthe latest trends in the crypto market. From Bitcoin to altcoins, I'lIl be sharing my insights and predictions to help you make informed decisions
about your investments. Follow me for the latest updates and join the conversation in the comments!
Crypto technical analysis uses past price history to predict future price. It's not a guarantee and shouldn't be relied on solely for investment decisions. Consider other factors such as market trends, economic strength and
information dissemination. Use with caution.
This Is Not A Finacial Advise

🟢 ARBUSDT 🟢 LONG - Local on 20.084-hour Chart - ARBITRUM BINANCE:ARBUSDT BINANCE:ARBUSDT.P
Following a strong bearish impulse, we observed a significant rebound.
A long-term movement is emerging through the MSS.
I anticipate a continuation of the bullish momentum towards the removal of EQH (liquidity shelf) within the range of 1.1921 - 1.2068.
... subsequently, I expect to witness a reaction and further downward movement towards the removal of SSL (0.8996).
P.S. If you liked the idea, hit the "Rocket" 🚀 (👇) – it would greatly motivate me. This will provide me with additional encouragement to continue sharing my market insights.
Subscribe ↗️ to stay updated on new ideas.

ARB USDT Bearish scenario for the YTD!Technical Analysis for this is Bearish, all the MA, Fib, and Structure says bearish.
Sentiment Analysis we just did a wall on it, so more news about how ARB will not be the narrative, which will be more bullish as to our next bull market scenario. The same narrative you get for SOL during 2018 when it was made, it reached its ATL on 1D tf. Crazy, then 2021 bullmarket entered everyone was rich. I cannot say more. ARB is going to be something I will buying more as it threads down. Wait for sideways buy only the confirmations. Watch Trendlines then match it with the news.


updatefollow plan
I am fairly certain that this is wave 5 of the larger wave 2, which will likely exhibit swift and strong characteristics to prompt retail investors to sell coins at a lower price and incur losses. I am awaiting confirmation of a bullish divergence. As you can see from the chart, you will notice a similar pattern of candlesticks that I circled before the price surged dramatically
NFA!

ARBUSDT Buynow ARB is in the good supply zone block and realy good position for buy whit nice RR
Check it on 5m

ARBUSDTHello
Ive updated my last chart by this one.
As the chart said, we will have a about 45% drop for ARB.
My last chart in ARB will be the bottom of this chart.

ARB buy setup Arb breakout from its past down trend and is now warming up for next move and is forming perfect pattern here is my buy setup for arb (always do your own research and control your risk before getting into a trade ) good luck

ARBUSDTNot an investment recommendation. This chart was made for personal study and personal use only. If you liked the idea, please like it. If not, write why. In my humble opinion, the price will go up.

Arb breakout is comingHello traders , here is a ARB analyze for you
I think we will see 1.22 in these days
