Arbitrum longArbitrum bounced off the ascending trendline and bounced off the support level. Bullish movement to resistance level at 1.31 is expected to happen.
ARBUSDT trade ideas

ARBUSDT wants the breakout ?ARBUSDT wants the breakout ?
Flag Breakout: ARBUSDT has experienced a clear breakout from a flag pattern. A flag is a continuation pattern that resembles a rectangle or parallelogram and forms after a strong price movement. A breakout from a flag often indicates a potential continuation of the prior trend.
Testing 0.618 Fibonacci Level: The price is currently testing the 0.618 Fibonacci retracement level. The 0.618 level is derived from the Fibonacci sequence and is a key level in technical analysis. It's often used to identify potential retracement levels during price corrections.
Resistance Flip: You've indicated that if the price manages to flip the resistance at the current level, you are considering a new long position according to your trading rules. Flipping a resistance level to support is a common technical pattern, where a former resistance level, once broken, becomes a potential support level for future price movements.
New Long Position: As per your analysis, a new long position would involve buying ARBUSDT with the expectation that its price will rise. This aligns with the potential bullish momentum indicated by the flag breakout and the potential support flip at the 0.618 Fibonacci level.
–––––
Follow the Shrimp 🦐
Keep in mind.
🟣 Purple structure -> Monthly structure.
🔴 Red structure -> Weekly structure.
🔵 Blue structure -> Daily structure.
🟡 Yellow structure -> 4h structure.
⚫️ Black structure -> <= 1h structure.
Follow the Shrimp 🦐

ARB/USDT is Ready to Fly, Arbitrum Analysis Today Dear Paradisers, Take Notes!
ARB finds itself at a pivotal juncture within a triangle formation, hinting at an intriguing turn of events.
💎 At this moment, ARB is making strides to emerge from this triangle. A successful emergence could pave the way for a bullish surge.
💎 However, if the bulls falter in their breakout attempt, ARB might circle back to test its support around the $1.11 mark. As always, the broader market's pulse will be instrumental in shaping this breakout's direction.
💎 On the whole, we're buoyant about ARB reaching these anticipated milestones. Stay tuned with #MyCryptoParadise for more insights!

Potential Long scalp on ARB 📈🔄 Eyeing a Potential Long Scalp Opportunity on AMEX:ARB before the anticipated downturn. Traders, buckle up for potential action! 🚀💰 #TradingInsights #ARB #ShortTermGains
ARB ARB moving in a range. Will look for breakout or breakdown. High chances of breakdown and might test lower horizontal support as it is making LH and LL.

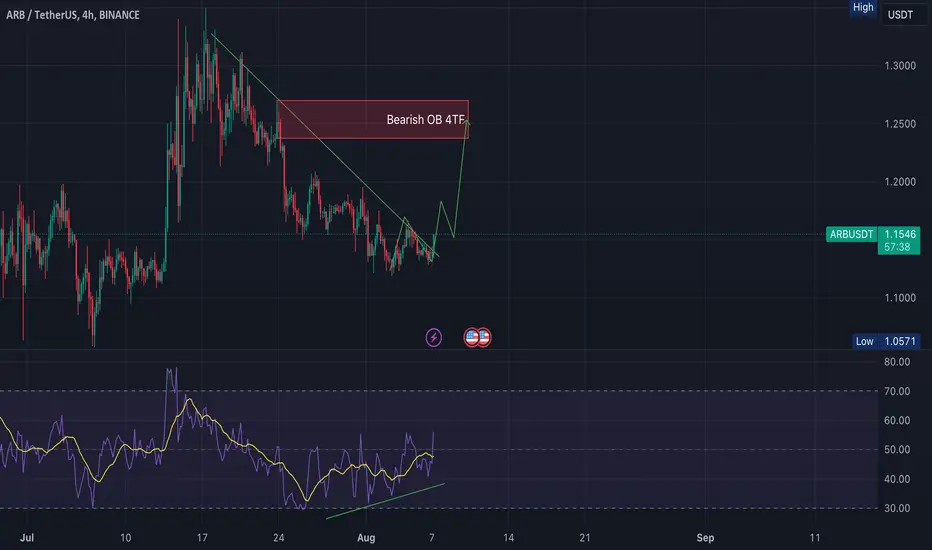
ARB/USDT Bullish move incoming?👀 🚀Arbitrum Today Analysis
💎ARB is making a fascinating move as it's currently trading in a demand zone and is primed for a bullish surge.
💎 A few days ago, it skillfully tapped into the bearish Order Block , made equal highs, and initiated a downward move to mitigate the Bullish OB and seize buying liquidity.
💎 Currently, it's nearing a crossover with the EMA 55. If the price maintains its momentum above this, it could trigger an upward move.
💎 Above, there's a supply zone where the price is expected to retest due to remaining liquidity.
💎 In the dynamic world of crypto, staying informed and adaptable is key. Stay tuned for more updates and enjoy your trading journey

Arbitrum For Next CycleEverything is clear based on this massive channel.
Buy spot on the borders or long/short same borders, inside the channel.
Would advice to start buying for long term between 0.75$ - 0.56$$ spot and hold.
Cheers )

ARBUSDTARBUSDT is trading at very important zone. Although the pair is in bearish channel but selling pressure is not favorable as there is strong bullish divergence at support zone. In past bulls took charge from this support zone. Will bulls again attack on this level?

ARB USDT Short to range lowARB USDT Short to range low
trendline is clear, ARB is open for a 1-24 h short

#ARB/USDT - Long - Potential 18.18%Direction: Long
Market: Spot
Risk: 0.25% - 1%
#USDT_ARB
Exchange: BINANCE
Timeframe: 360
TP1: 1.3504
Entry: 1.1427
STOP: 1.0477
At the minute we're seeing DEFI re-tooling for the coming bull run, with project announcements and development activity increasing (or at least increasing in visibility).
AMEX:ARB yesterday announced BOLD (Bounded Liquidity Delay), a dispute protocol that can enable permissionless validation for Arbitrum chain. In June the announcement (which I missed!) of the Orbit toolkit moved price 17% so I'm structured here to take advantage of a similar price range.
Personally I'm only working to the top target but the Fib levels on the chart should act as good incremental targets if you're taking a big position and want to lock in profits.
In terms of entry I'm waiting to break the trendline to confirm.
Let me know what you think!

Steady Growth Within Descending ChannelOver the past month, the price of ARB has been steadily increasing. Initially, it received positive support around $1.10, and buyers were able to push it up to $1.34. There is a descending channel pattern in the chart, and currently, the price is still trading within this channel. It seems that whenever the price reaches the upper limit of the channel, it encounters resistance, which has prevented further growth for now.
Looking at the daily time frame, there is a noticeable price range. If the support level at $1.10 is broken and the price drops to $1.055, there is a possibility that it may continue to decline further to around $0.97.
In summary, ARB's price has been on the rise, but it's currently constrained within a descending channel, with resistance at the upper boundary. If the support level at $1.10 is broken, we might see a decline in the price to around $0.97.

Liquidity Long then wait a breakoutDaily Chart
BINANCE:ARBUSDT is under the descending trend line and bounced from the support after Liquidity Long
Now, it's trading at 1.173x
Wait a breakout to go up 1.24

ARB Sell TradeHere is My Study On ARB.
Welcome to my channel! Here you'll find daily technical analysis ofthe latest trends in the crypto market. From Bitcoin to altcoins, I'lIl be sharing my insights and predictions to help you make informed decisions
about your investments. Follow me for the latest updates and join the conversation in the comments!
Crypto technical analysis uses past price history to predict future price. It's not a guarantee and shouldn't be relied on solely for investment decisions. Consider other factors such as market trends, economic strength and
information dissemination. Use with caution.
This Is Not A Finacial Advise


ARBUSDT 1h time frame analysishi Traders
Let's have do ARBUSDT 1h time frame analysis.
The price seems to be getting rejected by 200 EMA.
We expect a little bit more consolidation before breaking higher.
If it comes back down and retest the support, it will be a long opportunity
2 targets and take profit level are shown on the chart.
Good luck

$ARB invalidation below blue line
currently bouncing between the 2 and attempting to reclaim the 200 ema on the H4
stoch turning up

ARBUSDTARBUSDT idea 2023/07/30
-looking for buy opportunity in lower timeframe -
-analysis with multiple factor-
Dow theory structure = uptrend (H4)
CHOCH in Daily Timeframe (higher high)
Sell side liquidity swept
Double bottom at SR Flip zone
buy momentum from MACD H4
Discount zone (fibo 61.8-78.6)
-Can Entry Stop at Double bottom low
-Take profit OB sell or Major price

ARB has a potential great growth Hi Everyone;
today we have one of the coin in the market
it is more than 5 times the risk and the chart is look very promising.
the TA showing a small opportunity because it is a new coin but I expect more Risk to reward Ratio

ARB vùng mua dài we can set an alert and when the price is there we can split the capital and collect

ARBUSDT is about To do a Bullish movement!🤑The ARBUSDT is in a Bullish phase by a Falling Wedge Pattern.
-A BIG falling wedge indicates the potential for price to reach ATH.
⭐ Note if the Wedge Pattern is broken downwards with the strength of Bearish candles , this analysis of ours will be failed.
✅If this post was useful for you, like it ❤️ and if you think it is useful for your friends, be sure to send it to them.
_ _ _ _ _ _ _ _ _ _ _ _ _ _ _ _ _ _ _ _ _ _ _ _ _ _ _ _ _ _ _ _ _
🌍Thank you for seeing idea .
Have a nice day and Good luck.

$ARB AMEX:ARB is a new coin and definitely this is one of the bull run coin that will make max gain in 24-25 if you are accumulating, better to wait for 10% drop atleast, according to me bottom is already in for AMEX:ARB , DYOR NFA

Arbitrum shortArbitrum broke trough the ascending trendline. Asset broke trough the support level. Bearish movement to support level at 0.923 is possible.

