ARBUSDTThe overall situation of BINANCE:ARBUSDT can be described as follows:
A descending channel has formed, which confirms with multiple price bounces off the lower channel line. It is likely that the price will soon reach $1.40 from $1.16 and validate the hypothesis of the descending channel, shaping it further.
At the price of $1.40, we are witnessing a resistance line, and it doesn't seem likely that the market will be able to break through this resistance under the current conditions.
⚠️ "Daily crypto market analyses I provide are personal opinions & not financial advice. Trading carries risks, so do your own research & seek advisor's help."
Don't forget to like and comment
ARBUSDT trade ideas

#ARB/USDT breaks the Diagonal Trend line in 4-Hour TF!LSE:ARB is holding PDL as a support. Looks bearish to me, but #FOMC data can change the direction. The local resistance level is PWL $1.21, and the support is $$1.07.

ARBUSDT (Arbitrum @Binance futures) spikes upThe thing here is, that I don't say price is going up now, BUT if it does reach ~1.205 there will be massacre!
Liquidation map shows that there is cumulatively 8M dollars of short positions about to get liguidated if price goes up. There is not enough buys on orderbook to cover those so price will spike atleast to 1.217.
There is many ways to take advantage of that spike but easiest way is to put stop-market-order to 1.205 and take profit level to 1.217. Then you can jump to moving train even if it is already going full speed.
You can check BTCUSDT too. It will do the same but in smaller scale so less % profit to take.

Not Looking Good for AltsARB Looking like downwards is the way forwards at least for now. MACD crossed downwards, RSI about to go below 50 and T3CC looking to show red. Ontop of that ARB looks to be in a rising triangle. So far resting on the 100 MA on the daily, lets see if it holds.

ARBUSDTobv breaking bullish pennant
undervalued still probably from airdrop mechanics,
optimism marking up dont see why this one doesnt also
1.7$ range is possible if we hold above 1.45
but one thing at a time..

ARBUSDT With FTFI 4HHi My Traders Friends, Do You Like These two Indicators?
I Plan To Improve this further
I will share the Charts With You
Comment below the good and the bad

ARB buy TradeHere Is My Study on ARB
Welcome to my channel! Here you'll find daily technical analysis ofthe latest trends in the crypto market. From Bitcoin to altcoins, I'lIl be sharing my insights and predictions to help you make informed decisions
about your investments. Follow me for the latest updates and join the conversation in the comments!
Crypto technical analysis uses past price history to predict future price. It's not a guarantee and shouldn't be relied on solely for investment decisions. Consider other factors such as market trends, economic strength and
information dissemination. Use with caution.
This Is Not A Finacial Advise

Enter after failure and stabilizationARB currency has reached its downward trend line, so there is a possibility of a drop. This drop can be to the bottom of the channel, but before entering this position, it must break the support limits.
On the other hand, according to the formation of the head and shoulder pattern, there is a possibility of a growth of up to 36% for this currency, but before entering the long position, we must observe the stabilization in it, which means breaking the previous peak and exiting the channel.
In this case, we can have a secure entry.
follow us

Possible inverse head and shoulders on ARB Possible inverse head and shoulders on ARB with a measured move and price target of $1.60

ARBUSDT Long/SHORT Gr8ITAt a neat Boyzone after BTC did a healthy retrace n ARBUSDT too...
I Fell ATH 1.8 Sooner ..
Plz Never Put High Lev on trade I Give...
These are My views My Sis/Bro...
Plz Make sure Ur DYOR
NAFA
ThankYou...

Brief Analysis ——ARBAfter the FUD of SEC, as representatives of Optimistic-Rollup, OP and ARB rebounded stronger than many other tokens. In the second half of the year, ETH will usher in an important upgrade, Dencun, which will reduce the transaction fee of L2, which is beneficial to OP and ARB. And it is likely that other L2-tokens will appear in the second half of the year, making Layer 2 a new focus. Today we bring the brief analysis of OP, ARB and GMX.
It is also an Op-Rollup mechanism. ARB has performed better than OP recently. From the chart, after the rise in late June, the price has always remained fluctuating above 1.05. The bulls defended every increase in bear power. Neutral to bullish on a large scale. More recently, the long green candle last Thursday took the price to the high of Jun.27. Although candle on Friday eventually turned into an upward pin-bar. But the bulls defended the bears, and the price continued to rise without a pullback.
Conclusion: Mostly rising after a callback. We see strength of the bulls, but there is resistance at the previous high. Therefore, we think that the rise will probably not stop, but a pullback may happen. We set resistance level at 1.45 and support level at 1.22.
If you have any ideas, welcome to communicate with us:)
Disclaimer: Nothing in the script constitutes investment advice. The script objectively expounded the market situation and should not be construed as an offer to sell or an invitation to buy any cryptocurrencies.
Any decisions made based on the information contained in the script are your sole responsibility. Any investments made or to be made shall be with your independent analyses based on your financial situation and objectives.

$ARB, 2D Buy coming up on today's close?LSE:ARB
2D Buy from the UCTS indicator May get confirmed on today's close
😏

arb longThe credential prevents bots from being rewarded and improves ROI of your campaign by analyzing wallet activity on zkSync Era chain. Users are required to earn a 0+ score to prove eligibility. :)

ARB : Head and ShoulderDisclaimer
High Risk Investment
Trading cryptocurrencies and Forex carries a high level of risk, and may not be suitable for all investors. Before deciding to trade cryptocurrency you should carefully consider your investment objectives, level of experience, and risk appetite. The possibility exists that you could sustain a loss of some or all of your initial investment and therefore you should not invest money that you cannot afford to lose. You should be aware of all the risks associated with cryptocurrency and Forex trading, and seek advice from an independent financial advisor. Since Any opinions, news, research, analyses, prices, or other information contained on this website is provided as general market commentary, and does not constitute investment advice. The Bibres will not accept liability for any loss or damage, including without limitation to, any loss of profit, which may arise directly or indirectly from use of or reliance on such information. All opinions expressed are owned by the respective writer and should never be considered as advice in any form.
A qualified professional should be consulted before making any financial decisions.
-------------------------------------------------------------------------------------------------------------------

ARBUSDT 12H#ARB broke out of the Inverse Head & Shoulders formation on 12H chart. I'm still waiting to break 0.382 Fibo level to buy a bag of it. Targets will be $1.5085 , $1.6957 and $1.82

ARB, What it be?If you find this information inspiring/helpful, please consider a boost and follow! Any questions or comments, please leave a comment! Also, check out the links in my signature to get to know me better!
In at 1.1291.
Initial Elliottwave count and idea got blown up.
Had a plan B idea in the vid on it.
After being stopped, I cried, then watched how the PA played after the sweep.
Swift move up, corrective move to Algo zone.
Classic tradedevils setup played out.
Possibly a wee little W5 to pop the last pivot then maybe a turn, but I think 1.29 is the level to watch. Breaking below 1.1774 is sus.
My internal count idea, atm.
Cheers!

Check in for a flight or check out for a flight? The question isARB currency has reached its own downward trend in 4 hours, so the possibility of falling can be stronger, but if it leaves the rectangle pattern upwards, we can have a safe entry from the mentioned price. Don't forget to enter this cryptocurrency if the downward trend breaks. And the fixation will be on the said price

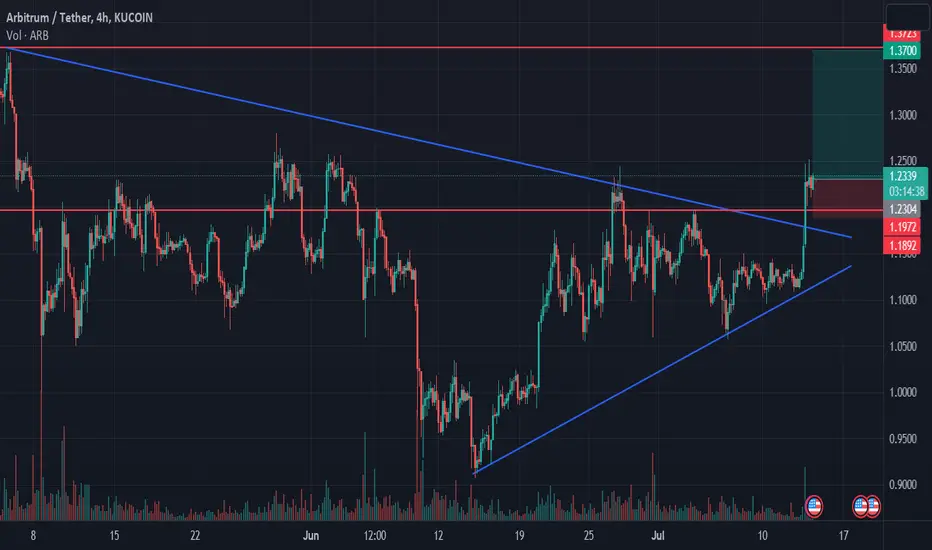
Arbitrum longArbitrum broke trough the descending trendline. Asset broke trough the resistance level. Bullish movement to resistance level at 1.37 is expected to happen.

Flight after landingThis new currency has dreams
This currency is in an upward trend but needs a correction before it grows

ARB potential HS aim to 1.282h time frame
-
ARM creating a potential inverted HS.
Good entry~1.075
TP: 1.24~1.33
SL: 1.018

✴️ Arbitrum Will Eventually Get There... The Wait Is Over!Arbritrum has been doing so, so... It has been consolidating since May with no real action, nothing of interest.
The 3-down pattern though can signal that the consolidation/correction is coming to an end. This pattern repeats over and over as bottoms form.
Another positive is that the current price trades above the 3-April low.
The negative is that EMA50 is still working as resistance but that's the last resistance before strong growth can take place.
If you are a bull and looking for higher prices, we are getting closer to what you are looking for... Let me make it simple, the wait is over.
Namaste.

ARB - long as wellHi, ARB is trying to break up. If this will happen its hard to predict what will happen because there is not much history behind. If such a scenario will be in play, I would take profits arround 1.48$, however this coin is really hard to predict. Hard to predict means it can be pumped to 3-4$ even.
