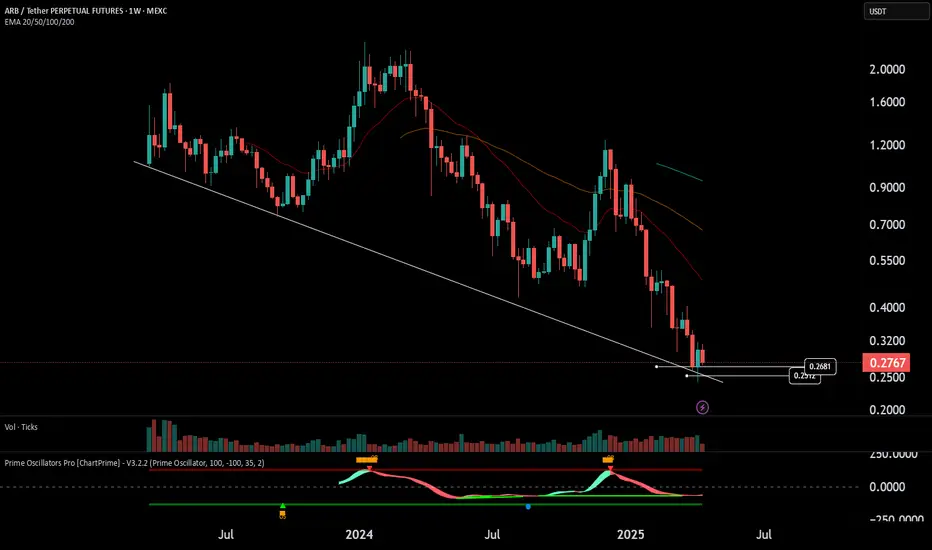
$ARB on a Multi-month support!AMEX:ARB is hovering on a multi-month support trendline, Bullish divergence forms on the oscillator using the ChartPrime oscillator pro.
If this support holds, 0.25 up to 0.268 could be a good buy zone for medium-term trade. @VIP
Note: using the logarithmic chart
ARBUSDT trade ideas
#ARB/USDT Analysis📊 #ARB/USDT Analysis 📊
AMEX:ARB is forming a Falling Wedge Pattern on the Daily TF—a classic bullish setup in the making!
📈 Key Levels:
Resistance: PMH $0.4662
Breakout Level: PWH $0.3167
💡 AMEX:ARB needs to break above the Falling Wedge and PWH, followed by a retest for bulls.

The Bullish Case of ARB#Arbitrum has been declining since early 2024, forming a complex bearish trend despite strong fundamentals.
This fall is likely a corrective wave ahead of a potential bull-run toward a new ATH.
Breaking $0.24 is a minor invalidation, possibly offering a better entry lower.

TradeCityPro | ARB: Key Levels in DeFi Coin’s Descending Channel👋 Welcome to TradeCity Pro!
In this analysis, I want to review the ARB coin for you. It's one of the DeFi coins, currently ranked 54 on CoinMarketCap with a market cap of $1.41 billion.
⏳ 4-Hour Time Frame
In the 4-hour time frame, as you can see, we're witnessing a downtrend within a descending channel, and the price is moving downward.
✔️ There is a very important support at the 0.2501 level, which is the main support, and the price has already reacted to it once, bounced from the bottom of the channel, and is now positioned above the channel’s midline.
🔽 If the price fails to reach the top of the channel and gets rejected from lower levels such as the 0.3172 resistance, the probability of the channel breaking to the downside increases, and more bearish momentum may enter. When the price gets rejected before reaching the channel top, it indicates weakening buyer strength.
✨ So, if the price gets rejected from the 0.3172 resistance, we can open a suitable position. The lower the rejection, the higher the probability of a drop. A rejection from the channel top or even a fake breakout can also act as a valid trigger.
📉 The main trigger for a short position is the break of the 0.2501 level, which is a very strong support, and its break can lead to a significant bearish leg.
⚡️ For a long position, the first trigger is the break of 0.3172, which is a good area but very risky, because just above it lies the channel ceiling, and the price might get rejected from there and move downward.
🔼 Therefore, it's better to wait for the channel to be broken first and then look for a long trigger. Currently, the most reliable trigger for a long position after a channel breakout is at 0.4018, but this level is quite far. So, for a long position, we can also enter on a pullback to the channel or after getting confirmation from Dow Theory.
📝 Final Thoughts
This analysis reflects our opinions and is not financial advice.
Share your thoughts in the comments, and don’t forget to share this analysis with your friends! ❤️

Arbitrum ARB price analysis💰 One can lose count of how many times the “next bottom” from #ARB has been given as "a gift".
⁉️ The only thing that can be assumed is that the behavior of the #Arbitrum price will repeat itself in a fractal fashion and grow to at least $0.57-0.67 by summer.
🪐 And then, if all the stars align with the parade of planets, and the OKX:ARBUSDT price will be able to gain a foothold above the aforementioned zone, it may continue to grow to $1-1.2.
It seems that once upon a time, this was the price at which #ARB was given away for free, and they forgot to think through one nuance: who will be pumping it if they are generously given to everyone)
_____________________
Did you like our analysis? Leave a comment, like, and follow to get more


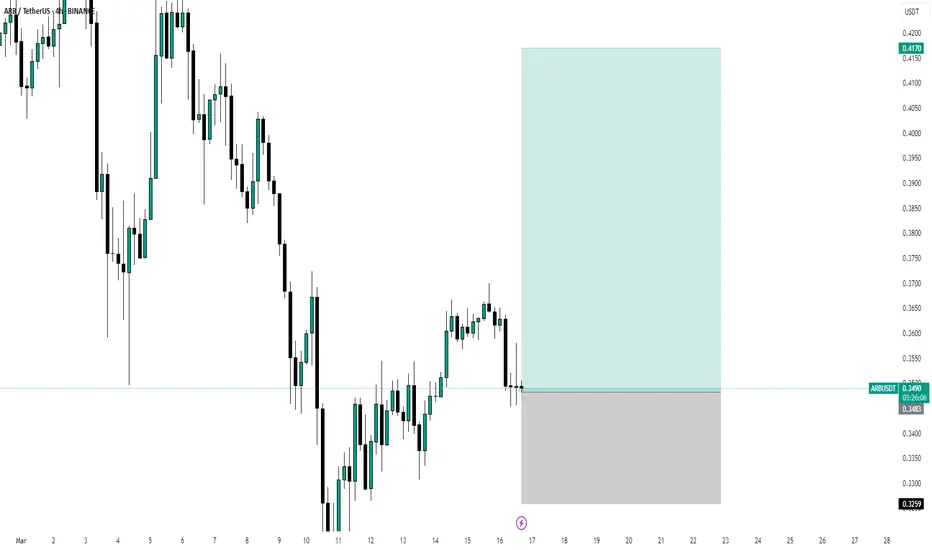
Here Arbusdt now After we're seeing the up wave,
Now time to comeback to a fresh zone as you can see here and then wait a false breakout and see it continue up

ARB DAILY ANALYSISHi friends,
In today's analysis, we pay attention to ARB in the Daily time frame.
We have a key resistance level in weekly and daily timeframes at the price level of $0.826.
As you can see, it is already priced in and has lost about 77% of its value from its local top.
We have a downtrend daily and 4-Hour Channel as marked on the chart. Also, volume is increasing, and it's a good sign.
We have an entry level for long positions after channel breaking from the upper side at the price of $0.3944.
Also, we can have our alarms on the price level of $0.5, which is good for spot entry.

#ARB USDTEvery high is an opportunity to get out, don't miss the opportunity to buy at low prices
Don't rush to buy, soon the prices of all coins will return to where they started.
Do not trade futures in this market, only spot.
Please check all my previous analyses, all of them came true

ARBUSDT: What Happens Next Could Shock ManyYello, Paradisers! Are you watching this key level hold by a thread? The market is giving us signals, but most traders are too distracted to see them. If you're not careful here, you’ll be on the wrong side of the next big move.
💎ARBUSDT is currently trading below both the 50 EMA and the 200 EMA, confirming a strong bearish bias in the market. The trend remains in a clear markdown phase, with price action continuing to respect the descending channel, and no clear signs of bullish reversal just yet.
💎We’re approaching a moderate resistance level around $0.32 has already shown signs of weakness if price fails again at this area, it will likely confirm that sellers are still dominating, increasing the probability of a renewed leg down.
💎If the market rejects at current levels, the first key support to watch is around $0.2847, which could be hit quickly. However, the real danger lies below. A breakdown beneath the $0.2847 zone would expose the market to significant downside pressure, opening the path for a much deeper correction.
💎With ARB trading below the 200 EMA, we must remain cautious. The trend remains bearish, and any short term rally into resistance is more likely to present a shorting opportunity than a bullish breakout.
💎Still, if the market manages to close decisively above the $0.35 mark, it could shift the structure and momentum, targeting $0.37 and higher in the short term. Until then, the bias remains with the bears.
Stay focused, Paradisers. Be the hunter, not the hunted.
MyCryptoParadise
iFeel the success🌴

Bear Market Will Continue For Arbitrum ARBHello, Skyrexians!
Despite we expect the alt coin's dominance bottom at approximately 25th of April some altcoins like BINANCE:ARBUSDT can continue the bear market even further. Looking at the price chart we found the most likely and realistic scenario.
Let's take a look at the daily chart. Here we can see that on the Awesome Oscillator price has not crossed zero line and this is extremely bad. There is a high probability that currently asset is not in wave 5, but in wave 5 inside 3. This subway has the target $0.15-0.27. We suppose that $0.27 is our case. We will see the bounce in wave 4 soon to 0.38 Fibonacci and then the new deep dive to $0.2 in the wave 5. We pointed out the most conservative targets. Price can go even lower, but in our experience it's not likely because the max targets leads to price below zero.
Best regards,
Skyrexio Team
___________________________________________________________
Please, boost this article and subscribe our page if you like analysis!

ARB/USDT: Bearish Pressure Builds Below Key ResistanceThe ARB/USDT market recently tested support before rebounding toward the psychological 0.400 level, forming what appears to be an ABC pullback, often a signal for an upcoming retracement. Price has moved above last week’s high, which may indicate a liquidity grab before a potential drop.
When comparing the current bullish pullback to previous stronger bearish moves, the broader momentum appears to favor the bears. If the market fails to break through the channel boundary, trendline, and the 0.420 resistance, a move lower is likely. The next target is the support zone around 0.3500

Lingrid | ARBUSDT pullback TRADE. Potential SHORT OpportunityBINANCE:ARBUSDT market tested the support level before rolling back toward the psychological level of 0.400, appearing to form an ABC pullback that typically precedes a retracement. With the market moving above last week's high, I anticipate a potential price drop after it grabs liquidity above that point. A comparison of the current bullish pullback with the stronger bearish moves on the left suggests the bears are more dominant than the bulls. If the market fails to break through the channel border, trendline, and resistance at 0.420, we can expect a downward movement to lower levels. My goal is support zone around 0.3500
Traders, If you liked this educational post🎓, give it a boost 🚀 and drop a comment 📣

ARBUSDT 1DARB ~ 1D Analysis
#ARB Buy gradually after successfully penetrating this resistant line with a short -term target of at least 10%+.

ARB/USDT – The zone is interesting for starting accumulation.Arbitrum - is an Ethereum layer-two (L2) scaling solution. It uses optimistic rollups to achieve its goal of improving speed, scalability and cost-efficiency on Ethereum. Arbitrum benefits from the security and compatibility of Ethereum. Another benefit is the higher throughput and lower fees compared to Ethereum. That is made possible thanks to moving most of the computation and storage load off-chain.
Arbitrum’s native token is called ARB and is used for governance. Offchain Labs, the developers behind Arbitrum, announced the shift to a decentralized autonomous organization (DAO) structure — the Arbitrum DAO. ARB holders can vote on proposals that affect the features, protocol upgrades, funds allocation and election of a Security Council.
CoinMarketCap : #51
The hyped-up Arbitrum! 😂
📉 January - February - March 2024: Bloggers trapped a huge number of people, and now we’re seeing a massive -87% decline!
Looking at the main trend, a large descending channel is forming. The price is currently at the support of the inner channel, and if the market makes a final liquidity grab with a downward wick, the price could head toward the support of the outer channel, targeting a -30% drop.
In my previous trading idea, I marked the 1.1552 zone, which is exactly where the price reversed. Everything is marked on the chart—the potential profit is very solid, especially for spot trading. The price will react strongly to the resistance zones of both the inner and outer channels.
🚀 These are the moments to watch for position accumulation—when no one is interested and belief in growth is dead, not when everyone is screaming "BUY NOW!" at local tops!
*I will update the trading idea as the trend develops.

ABRUSDTHello guys, I hope you are well. We have ARB on the 4-hour timeframe. As you can see, on the daily timeframe, it is possible that we will have an engulfing. This will be confirmed when the price rises above 0.37. That is when we can say that the trend will be completely bullish. Prices will even see the fourteenth. If the price drops below 0.35, the probability of the downtrend continuing will reach 0.3192.

ARBUSDT Is About To Move Up 7% !!!Based On My Trading Algorithms ARBUSDT Is About To Move Down 7%!!!
Arbitrum ARB Is About To Flash Insane Long Signal!Hello, Skyrexians!
We decided to find the crypto assets with the largest potential and the proper Elliott waves structure and found BINANCE:ARBUSDT which is still at the bottom but has a great chance to print the super strong long signal.
Let's take a look at the weekly chart. We can count all the price action on the Binance exchange as the large irregular correction ABC. Wave C lasts already exactly one year. This wave always consists of 5 waves and here we can have a clear counting. Look how perfect was the wave 4 touch of 0.38-0.5 Fibonacci zone. Now price has reached the maximum target of wave 5. In conjunction with the divergence with the Awesome Oscillator, angulation with Alligator and potential green dot on or Bullish/Bearish Reversal Bar Indicator we can conclude that probability of reversal now is more than 80%. The only one thing we need to wait for the next week to see the green dot confirmation.
Best regards,
Skyrexio Team
___________________________________________________________
Please, boost this article and subscribe our page if you like analysis!

ARB: Capitalizing on Layer 2 Scaling Growth
Description:
This trading idea focuses on ARB, the native token of Arbitrum, a leading Layer 2 scaling solution for Ethereum. ARB plays a key role in enhancing transaction speed and reducing fees while maintaining Ethereum’s security and decentralization. With increasing demand for scalable blockchain solutions, Arbitrum has emerged as a dominant player, attracting developers and liquidity to its ecosystem. As DeFi, NFTs, and Web3 applications continue to expand, ARB is positioned for potential long-term growth due to its strong adoption and ongoing network upgrades.
However, cryptocurrency investments carry inherent risks, including market volatility, regulatory changes, and macroeconomic factors. The performance of ARB can be influenced by shifts in investor sentiment and competition in the Layer 2 space, making risk management essential for traders.
Disclaimer:
This trading idea is for educational purposes only and should not be considered financial advice. Trading cryptocurrencies like ARB involves significant risk, including the potential loss of your entire investment. Always conduct thorough research, assess your financial position, and consult with a financial advisor before making any investment decisions. Past performance is not indicative of future results.

ARBUSDT BUY OpportunityARBUSDT is moving within an ascending channel. The plan is to accumulate within the designated buy-back area and use the recommended stop loss. Following the success of our last analysis on this coin, we anticipate similar profitable outcomes. Targets to watch are delineated on the chart. Enjoy.
Checkout the last work done on this:

Three big goals for ARBGiven ARB's investments in meme coins, ARB could be of interest to the market, it has bigger goals, but we are currently holding on to the first resistance.

Breaking: Arbitrum Surged 12% Today- Enroute Bullish BreakoutArbitrum spike 12% today amidst the general crypto dip. The Ethereum layer-two (L2) scaling solution that uses optimistic rollups to achieve its goal of improving speed, scalability and cost-efficiency on Ethereum was in a prolong dip that saw its token dipped to $0.37 level with growing momentum a breakout above the $0.622 resistant point could pave way for major breakout for AMEX:ARB coin as that is the current barrier holding AMEX:ARB from breaking Out.
With the Relative Strength Index (RSI) at 43, AMEX:ARB could capitalize on this growing momentum. Further validating the bullish thesis is the fact that AMEX:ARB is trading below key moving averages.
Data from DefiLlama shows about $2.576 Billion is locked in the Arbitrum ecosystem. This numbers shows a level of trust placed on the layer 2 ecosystem. Similarly, about $1.276 Billion volume has been circulated in the Arbitrum ecosystem for the past 3 days.
Arbitrum Price Live Data
The live Arbitrum price today is $0.424093 USD with a 24-hour trading volume of $393,289,251 USD. We update our ARB to USD price in real-time. Arbitrum is up 11.42% in the last 24 hours, with a live market cap of $1,874,197,514 USD. It has a circulating supply of 4,419,312,625 ARB coins and the max. supply is not available.

