ARKM | Pullback Before Continuation | 40%ARKM had a phenomenal run-up, but I think now it's time for a pullback. It should bounce back at around $1.5, where the SMA-200 is, and the place it went into overdrive on the way up. Whether it can reach new all-time highs remains to be seen.
ARKMUSDT trade ideas

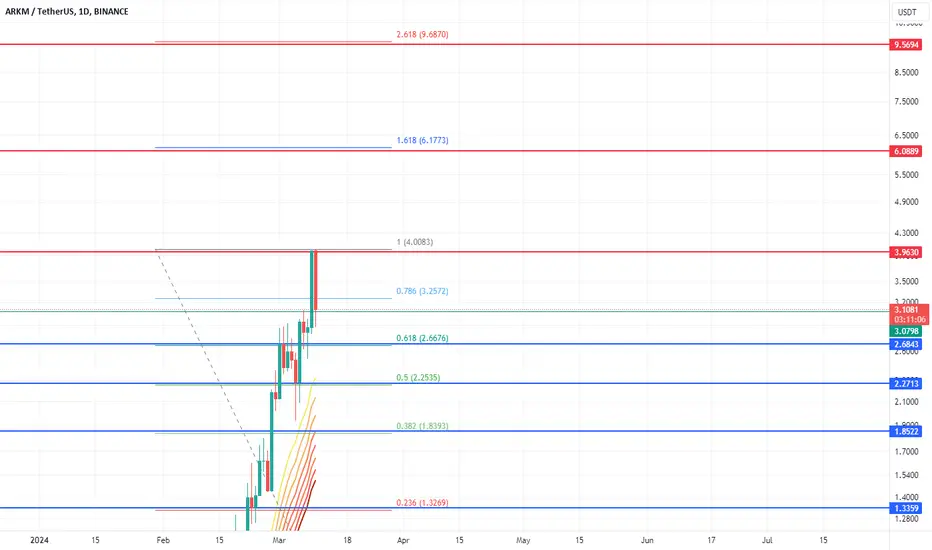
ARKM Found Support/RetraceARKM seems to have found some support. Now we have 3 targets for the retrace.

ARKM USDTARKM USDT is in range bound structure. Placing order on both sides keeping in view to either break above resistance or below support lines. in this setup one order will cancel the other if any of the mentioned level is triggered.

Still finding a support around $1.47 | Short Bias4h TF
ARKM has broken and closed below $1.93 and now it's pulling back to resistance around $2.3
I expect BINANCE:ARKMUSDT will reject and down to $1.47
Wait for confirmation before you trade
Time will tell

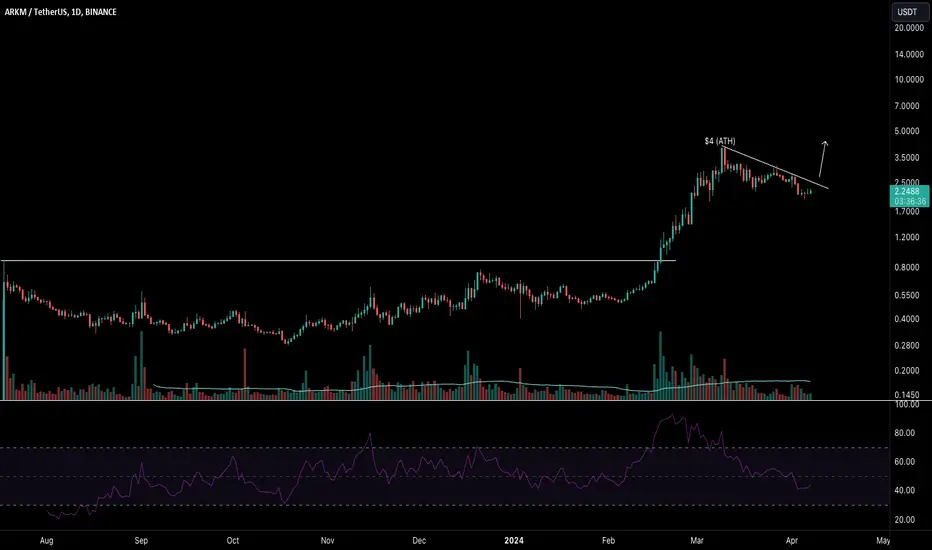
Next legBroke out of it's ICO base in February which led to a 4x run. Consolidating via flag and looks ready to go for next leg higher. Altman & Draper are backers
ARKM/USDT It required to bounce from the support or break down!💎 Paradisers, #ARKM has recently undergone notable market dynamics.
💎 Currently situated around the support area, ARKM has previously demonstrated a pattern where it successfully bounced off this support, leading to significant upward movement.
💎 There's potential for ARKM to repeat this pattern, with a bounce followed by a breakout above the resistance of the falling wedge, potentially leading to a backtest of the resistance at the all-time high (ATH).
💎 However, if ARKM fails to maintain support and breaks below it, the next likely stop is the daily bullish OB.
💎 Should ARKM reach the Bullish OB area, there's significant potential for a strong bounce, given that this area has not been tested before. Reclaiming the price above the support area would be crucial for ARKM to confirm a continuation of the upward trend. Failure to do so could lead to bearish momentum and further downward movement.

Finding the support | Long BiasOn day chart
ARKM is pulling back to $2 now
Last pullback was downed nearly 50% on Dec 2023, so I think it can be repeated
Time will tell

🔥ARKM Is Copying Aptos Patern: Is +360% Profit Real❓Arkham fell by -55% after listing on Binance. As you already know, you should pay a strong attention to such fresh altcoins, because they have the biggest opportunity to grow.
The best example is an Aptos which grow by +400% and me and Altcoins Gems members bought it. Additionally, you can check such altcoins as WRX, SOL, AXS which was listed at hte beginning of the previous bullmarket and grow by more then 100X!
💥The closest targets for ARKM are $0.72 key level and $1.8-2 value area.
The list of FRESH altcoins to pay attention to:
1. WLD (already +80%)
2. SEI
3. SUI
4. MAV
5. ARB
6. EDU
like❤️ and follow
Check the links and get a BONUS🎁 from me👇

ARKM/USDT Price shows downward momentum, Keep an eye on demand!💎 ARKM has recently undergone significant market dynamics, notably breaking the support trendline. The recent upward movement appears to have been a retesting phase on the resistance before a continued downward trend.
💎 For traders, the optimal entry point may be waiting for the price to reach the demand area around $2.1. This area indicates a potential continuation of the downward movement from the current price level.
💎 However, if ARKM fails to bounce upon reaching the demand area, there's a possibility of further downward movement towards the Bullish Order Block (OB). In the Bullish OB, one can expect a strong bounce and a potential reversal to the upward movement.
💎 On the contrary, a bearish scenario would unfold if ARKM failed to sustain itself within the Bullish OB area, resulting in a breakdown.

ARKMUSDT BUY IDEABearish environment = counter trending
Wave divergence, so possibility of short term bounce
Entered in my local support zone
Aiming for retest of the bearish structure and exit
Manage your risk

ARKM/USDT Ready for an Exponential Rally? 👀🚀ARKM Analysis💎Attention, Paradisers! #ARKMUSDT is stirring interest, gearing up for a bullish shift from the critical support at $1.92. If $Arkham can hold its ground at this juncture, there's a significant chance for a bullish escalation, reinforced by the price honoring this level three times previously, establishing it as a fortress of support.
💎If the rise of #ARKM begins to waver and it slips below the $1.92 mark, we'll then focus on a lower demand zone at $1.27. Given the abundant liquidity at this level, we anticipate a probable visit and subsequent rebound.
💎Being alert is crucial: a descent past this secondary support may signal an extended bearish phase as market sentiment shifts towards a sell-off. Keep your eyes peeled, traders, as we navigate through the fluid landscape of the $ARKM market.

ARKM/USDT Making series of lower highs and lower lows. anothor lower low will result in further downside.
Taking short position.

Arkham (ARKMUSDT) Hints at Potential Upswing.Arkham (ARKMUSDT) Hints at Potential Upswing
The Arkham ( BINANCE:ARKMUSDT ) chart suggests a possible move upwards after a week-long period of consolidation with price correction. Here are some bullish indicators:
Price Consolidation: The recent price movement might be a setup for a breakout.
Increased Trading Activity: Rising trading volume and market capitalization often indicate growing buyer interest.
While predicting exact prices is difficult, here are some key points to consider:
Breakout Confirmation: Will ARKM decisively break above a key resistance level?
Sustained Volume: Does trading activity continue to increase and support the upward move?
If you're considering a long trade on ARKMUSDT, here's a potential entry strategy:
Wait for Confirmation: Enter after a confirmed breakout above resistance.
Price Target: Consider the previous day's closing high as a possible entry point.
Moving Average: The 120-day moving average can be used as additional confirmation for the breakout.
Important Reminders:
This analysis is for informational purposes only and not financial advice.
Do your own research before making any trades.
Consider using stop-loss orders to manage risk.


ARKM 16/03/2024 Arkm is going to fill the 4h imbalance. I want to see the reaction at this level. If it wont be enough then we should look for 1.80 level and the daily OB.

Rektproof Set up by KuroroBTC @Kuroro__666A sample range play where in the equal lows for $ARKM was swept and made a change of character, confirming the deviation. Bid on the bullish order block and target the range high.
This trade aims to have a 8R profit

Keep an eye on $ARKM/USDTDid you find this crypto market analysis helpful? Stay updated about the latest crypto market update.
Please continue to follow my analysis and feel free to ask any queries, you may have. I am here to assist you.
TradingView: @FarmanBangashh

ARKM/USDT 12/03/2024Arkam has a 4-hour imbalance below. It might fill that before reach to our targets. Or it might make the current area as support area to reach the target levels. In this scenario, it needs to break the market structure at the current level. Otherwise, it will seek lower liquidities. First, at 2.45 we need to look for the reaction at that level, if it isn't enough it will end up going 1.80 and the red box below.

ARKMUSDT BULLISH (Harmonic AB=CD)ARKMUSDT shows a bullish momentum as soon as it hits the LH and make new HH. Price actions also shows harmonic AB=CD with a price target going up to TP5. There is no divergence and also open interest is increasing.
***Trade Plan***
Entry @ Buy Stop
Stop Loss @ previous LL
TP1 to TP5 @ 1:5
What do you think, will it work?

ARKMUSD - Sideways Movement After Big MoveMajor trend line in solid green
I expect a double top to form after this high, with then sideways movement back towards that strong trend line
This is similar to MATIC's first run up which was explosive but followed by sideways movement

Huge potential on Arkham After breaking the 0.78 usd resistance, the cup handle formation target reaches 2.17 usd. With great tokeneconomics, there will be only 14% more supply until the end of 2024, which means only 170 million circulating supply at the end of 2024, which is a great advantage for investors. NOT FINANCIAL ADVICE

This is how I am playing ARKMWith blue, lines I am adding to the position, In red levels I am taking profit. The thin green line is my first entry