ARK: 100x in the makingMulti year compression, this is simply one of the best set ups in crypto today.
Heavy volume & sharp price moves
ARK didn’t just move—it ripped ~75% in one swing, with daily volume pushing $6–7M. Weekly upside is outpacing the market, classic sign of real demand coming in.
ARK’s more than a meme—it’s built on Delegated Proof of Stake (DPoS), with forging delegates, fast blocks, and governance on-chain. Utility’s there to support a legit move if adoption increases.
Alt season is underway. ARK’s strength isn’t just tagging along—it’s showing independent bullish structure with real volume behind it.
ARK’s showing proper strength—strong volume, clean technical structure, ecosystem fundamentals, and broad altcoin momentum.
ARKUSD trade ideas
ARK COIN - ARKThis is one of my most favorite coins.
In terms of risk-reward ratio this looks amazing, your looking at potentially 100x targets.

How would current market sentiment affect Ark's movement?Hello, fellow traders!
This is my analysis on Ark (ARKUSD).
1️⃣ Analysis
Before looking into Ark’s chart, I want to address the current market sentiment first. Bitcoin, Ethereum, Dogecoin and many other cryptocurrencies hav experienced significant pullbacks, with BTC Dominance rising from 55% to nearly 57% yesterday – reflecting fear throughout the market. (My chart timezone is UTC-5.) Whether this is temporary remains uncertain. With that context, let’s now look at the Ark’s chart.
This is a daily chart for Ark.
Ark’s price remains inside the channel, which is a positive sign since trading within a trend is safer than trading outside of it.
The current price is slightly below the Price Action Zone (PAZ). Yesterday’s candle closed inside the zone, and this is important as it suggests a possible rebound. If the candle has broken though the zone entirely (as it did on June 18th), the likelihood of a rebound would be lower.
The current candle still has the potential to turn green (indicating a bullish reversal), as Bitcoin has also turned green, forming a doji star as I write. Additionally, BTC Dominance has turned red after forming a long upper wick, hinting at the possibility of a continued rally. Check the charts below.
2️⃣ Expectations
Ark, like any other altcoin, will be heavily impacted by the overall market sentiment.
With 15 hours remaining until the current daily candle closes (as of now), there is still a chance that the current downtrend could halt or even reverse. If the current candle closes within the PAZ or better yet, turns green like Bitcoin has, it could signal the potential for further recovery after the correction.
But even then, we want to keep our eyes on BTC Dominance to keep track of market sentiment. We always want to respect and trade along with the overall trend.
Dogecoin is also worth watching since it’s leading the current altcoin rally. Earlier today, its price dipped below the uptrend channel but has since rebounded back within it. If it remains so until the candle closes, this could indicate that the rally will continue longer. (Or at least it’s refusing to stop now.)
Now, the best scenario would be price rebounding at the Area of Confluence (red box in the chart above, AoC in short) where the uptrend channel’s support line meets the 0.53963 level. However, the current market sentiment might not allow this to happen.
3️⃣ Key approach
Our first strategy is to enter long after confirming a rebound within the PAZ. This is highly plausible since many symptoms indicate that the rally could regain momentum after the correction. As mentioned earlier, Bitcoin’s candle has turned green, reentering the major demand zone. Dogecoin is currently forming a doji star and BTC Dominance candle has also turned red with significant volume – signaling a potential market recovery. If the market overcomes this correction, it is very likely that Ark will also follow the market sentiment and resume its uptrend.
That said, the safest entry would be to wait for a confirmed rebound at the AoC, but the current symptoms suggest that the market might not wait for Ark to reach the AoC before reversing its trend – making a more proactive approach worth considering.
4️⃣ Other approach
Now of course, because we still have a long time until the candle closes, the opposite scenario is entirely possible. BTC Dominance might turn green again - the correction might continue even with bigger momentum. In this case, Ark could close below the PAZ and potentially face further declines.
If this happens, I will post a separate idea regarding a new approach.
5️⃣ Considerations
Ark, as I mentioned in the previous post on it, has faced allegations of being subject to pump-and-dump schemes. Additionally, with a market cap of only 111 million USD and a ranking of 410, Ark is highly volatile - given these factors, investing in Ark for the long term could carry some risks.
React, don't predict! Stay disciplined and patient. Don't get greedy and be thankful.
God bless :)
Hebrews 11:6

Ark's next peak?Hello, fellow traders! Long time no see. I apologize for the late post.
This is my analysis on Ark (ARKUSD).
1️⃣ Analysis
Looking at the daily chart of Ark, we notice a big spike in 2018 with price reaching near 12 at its peak. We then see a much smaller spike in 2021 with the price reaching 3.5, followed by an even smaller spike in late 2023 with 1.9. We see the price under 1 USD if not for these spikes as we are now. These kinds of volatile movements suggest that Ark might have been subject to market manipulation over the years and there’s even a paper about Ark being a target of ‘pump and dump’ scheme. While I cannot say for sure, the chart data is convincing to such allegation.
Zooming into the recent bars, we see the price gradually reaching the price action zone. This zone, as the name suggests, has shown multiple price actions in the past. With BTC breaking through the major resistance level and peaking its new high every day, Ark could also benefit from such a rally – one certain thing is that it will be a bad idea to trade against the current market sentiment.
2️⃣ Expectations
With the historical bull rally on its side, Ark might attempt a breakout of the zone as we’ve seen in other cryptos recently.
However, there are several factors I want to address.
The previous crucial breakouts were all delivered with decisive and strong momentum – breaking through the price action zone with a single bullish candle (or multiple smaller ones). This would’ve allowed us an opportunity to enter long after confirming the rebound at the retest. However, the current movement of Ark is not showing such momentum. Instead, it is slowly and steadily approaching the zone, increasing the possibility of a rebound.
But here’s the twist: With Bitcoin recently breaking through the resistance line after some consolidation and Tron also breaking through the demand zone and recording new high (despite its slow uptrend over the year), this is a time of great uncertainties and adventure – we cannot assume that the zone will be respected for Ark, either.
Another factor is that we see a very similar pattern in February 2019.
We see a decisive, strong bearish momentum in November 2018 (just like we see in June 2024) and a ‘relatively’ steady uptrend in February (just like we see in September 2024).
This was the time when Bitcoin started a bull run with its price quadrupling in 5 months from 3k to 13k. Meanwhile, Ark failed to break through the zone even with such momentum in the market. This suggests that Ark may not always follow the market movement.
So here’s the summary.
1. The crypto might be a target of market manipulation based on its unusual chart movements and studies.
2. The only significant breakouts have happened with a strong, temporary momentum breaking through the zone which we don’t see right now. Instead, we see a slow and steady approach to the zone.
3. The crypto has past of not following the market movement as Bitcoin quadrupled its price in few months.
➡ These sets of mixed information really give me headache and I apologize if you came here for a prediction. But below are some suggestions for how we might make profit from such a confusing analysis.
3️⃣ Key approach
Our first strategy is to enter long after conformation. There are three possible entries.
The first and the most obvious one would be entering after 1. Breakout of the zone and 2. Rebound at the retest. Our initial exit would be slightly below 0.78672. Our next exit would be slightly below the resistance line of the uptrend channel, around 0.81. Our next and final exit is very interesting, though. If the price continues to rise after the first two exits, this could potentially signal the 4th spike.
I found something interesting as I was analyzing the chart – as you see in the chart above, the price of each spike’s peak has been very close to the square root of the previous spike’s peak so far. Of course, there’s no guarantee that this pattern will continue, but if it does, the next peak would be around square root of 1.86380, which is 1.36521 - applying the error, the estimation would be 1.28330. So, this would be our final exit.
I want to make clear that this is not a prediction, it’s a vague idea of where we might want to close our long position in the future. We don’t know the future. We don’t even know if the pattern will continue, and it only has been a year since the last spike, too. My point is you are fine with exiting earlier and frankly I would recommend that, too.
Our second entry would be after 1. Break of Structure at the price of 0.78672 and 2. Rebound near the resistance line of the channel. Honestly, I don’t recommend this entry as much because trading outside of the trend leaves us with a lot of uncertainties just like the current status of Bitcoin.
Our initial exit would be slightly below 0.87789. I recommend exiting slightly below the major line to play safer – price may not touch the line at all. Our next exit would be slightly below 0.98261. If the price ever surpasses these two exits, our final exit would be around 1.28330 (which also happens to be close to the peak on March 14th.)
Our third entry would be entering after confirming the rebound near the support line of the channel. This entry is most unlikely due to the current market sentiment, yet it is the safest of all three entries. Our exit would be below the price action zone.
4️⃣ Other approach
Our second strategy is to wait until the price reaches near 1.28330, which is my estimation for the next spike’s peak. After confirming the rebound, we will then enter short. Our ideal exit would be the price action zone, but feel free to exit whenever – it could be very stressful watching the market moves.
Personally, I would close the position before the price ever reaches the zone. I learned to be thankful and satisfied with the profit even if it is not as big as it could’ve been. Nobody really knows the future: it’s probably better to lock in profit while you can. I say this because I know how stressful it gets – EVEN IF the price eventually reaches the target price. This also works for me because I can rotate my assets into new opportunities more often as a full-time trader.
I want you to view my exit points as ‘an ideal time and price to exit’ rather than a fixed one, is what I wanted to say.
5️⃣ Considerations
Like I mentioned couple of times, Ark could be subject to ‘pump and dump’ scheme so keep that in mind and be extra cautious. Also, the crypto only has market cap of 109 million USD which is very small.
I’ve also mentioned that Ark has a history of not following the market movement. And it doesn’t seem to follow it right now, either. However, two recent spikes were indeed fueled by Bitcoin’s aggressive uptrend in December 2020 and October 2023. This mix of information gives us a lot of confusion which leads to my conclusion below 😅
React, don't predict! Stay disciplined and patient. Don't get greedy and be thankful.
God bless :)
Deuteronomy 6:5
Thank you for reading the long analysis and I apologize for the late post. I’ll try to post more frequently.

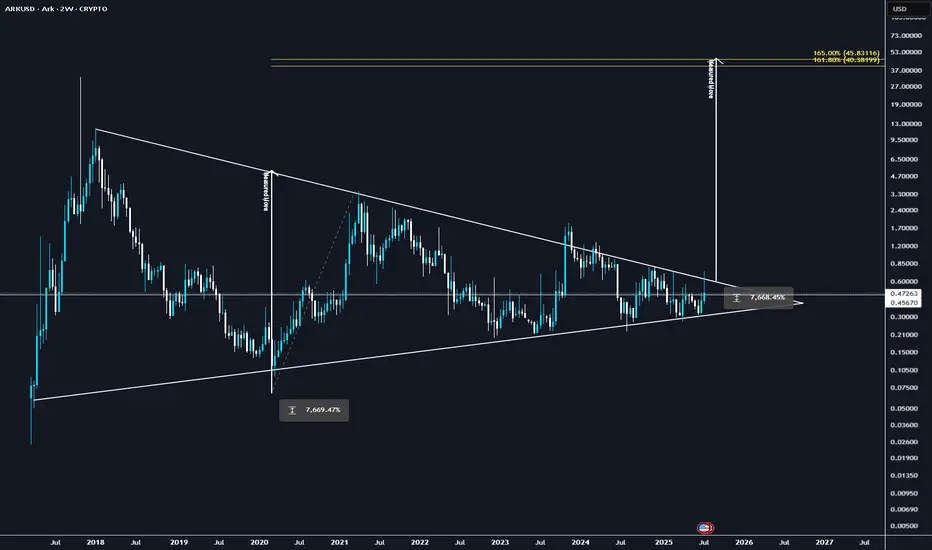
ARKUSD bull ideaAs we see, ARK has formed triangle, in my opinion bull triangle. Target is very high, but first we have to pass upper resistance. Let wee see and comment!!!

ARK LOOKS BULLISHBefore anything, pay attention to the time frame, it is big and time consuming.
It seems that wave A is over, that the structure of this wave was a flat with terminal C, and now the price has entered bullish wave B.
By maintaining the green range, it can move towards the targets.
Closing a daily candle below the invalidation level will violate the analysis
For risk management, please don't forget stop loss and capital management
Comment if you have any questions
Thank You

ARKUSD in problem?While every coin is going UP, ARK is going down. Now, ARK has a big problem with resistance of 1 usd.
Because of that I predict price of 0,66 usd very soon.

ARKUSD correction to 0,66usd?I see possible target of this correction, 0,7 usd.
Long term good position in my opinion.

ARKUSD target price 1 usdhead and shoulders with target of 1 usd
big growth in few months
price need correction

ARK 50% Breakdown!!! Watch the VideoNot financial advice.
All charts are made on current market conditions.
Like Follow and comment .

✴️ Classic Altcoins Moving First | Ark (300%+ Potential)This is an easy pattern to spot now. The Altcoins move in groups, sometimes DeFi, other times NFTs, other times Memecoins, Smart contracts, etc.
We are now seeing the "old projects" or classic Altcoins moving strong/bullish first.
Some of the ones already published, you can find them by tapping my username, are Steem, Ontology (ONG), Civic (CVC) and Stratis (STRAX)... Every hour a new one breaks out and grows in the two digits beyond 50%. One grew by more than 190% in a matter of hours and this is only the beginning.
ARKUSD just produced a major breakout growing more than 80% since its mid-June low.
The strong signal here is the fact that the current session is trading above its May 2022 low. Patience is key. An entire year has been recovered in a single day.
This is a nice setup that can lead to 300% growth more or less.
Expect this pattern to repeat, sudden yet strong bullish breakouts, and use this information in the best way you can.
Namaste.

ARK 3549% from ATH ! what are you waiting for ?Whatsup Guys , i hope you doing well.
Another one for you , keep in mind that nothing what i post on Tradingview is an Financial Advise.
Dont go crazy , Don't go 100x 200x , don't gamble , only invest.
Stay Safe , wash your hands , keep distance and keep investing in your own future
TradingEagle38 //


Ark journeyI am extremely bullish for ARK.
It tested the support and now starts to increase.
This is a monthly chart, so in the coming months, I am looking for an ATH.
It is not financial advice, just for fun. I will check this chart later in October.


Ark (ARK) - September 12Hello?
Dear traders, nice to meet you.
"Like" is a huge force for me.
By "following" you can always get new information quickly.
Thank you for always supporting me.
-------------------------------------------------- -----
The area below the 0.34815620 point is the section that formed the bottom as a mid- to long-term investment area.
Therefore, you need to make sure you can get the support at the 0.34815620 point.
We believe that further gains can be expected if the bottom line is formed, but only supported by the uptrend line (1).
By touching the uptrend line (2), I think you showed your willingness to rise.
Accordingly, it remains to be seen if it can rise above the uptrend line (2) and above the downtrend line (3) around September 30, with support above the 0.34815620 point.
You should also check if you can get support at point 0.44963448.
-------------------------------------------------- -------------------------------------------
** Check support, resistance, and abbreviation points.
** Support or resistance is based on the closing price of the 1D chart.
** All explanations are for reference only and do not guarantee profit or loss on investment.
Explanation of abbreviations displayed on the chart
R: A point or section of resistance that requires a response to preserve profits
S-L: Stop-Loss point or section
S: A point or segment that can be bought for generating profit as a support point or segment
(Short-term Stop Loss can be said to be a point where profits and losses can be preserved or additionally entered through installment trading. You must trade from a short-term investment perspective.)


ARK/USD trend reversal - Within a weekARK/USD is indicating the end of consolidation at this price level. The next price change is going to be upwards and possibly testing $0.20. Giving this trade until Jan 25th to test $0.20.


ARK Elliot Wave Cycle and Bear Market CompletedThe first Elliot wave that brought ARK from pennies all the way to ~$12 seems to have been completed.
My subway count leads me to believe that this ABC pattern is valid.
This weekly candle finishes in a few hours and looks very likely to finish off strong.
We also have a very strong break out of the smaller downwards wedge pattern.
This could lead us to eventually break out of the larger wedge pattern which could take us well past
the previous high of $12 over the next few years!
check out my website for more content like this: cryptoplanet.cash
I post-market analysis and daily original crypto news articles!
telegram chat: bit.ly

$ARK Elliot Wave AnalysisThis post mostly focuses on the subwaves of the ABC corrective wave
the 12345 for the A wave is shown
the ABC that makes up the B wave is shown
and the 12345 that makes up the C wave is also shown
let me know if you guys believe that this is correct!
www.cryptoplanet.cash
