A trading opportunity to buy in ARKUSDTechnical analysis:
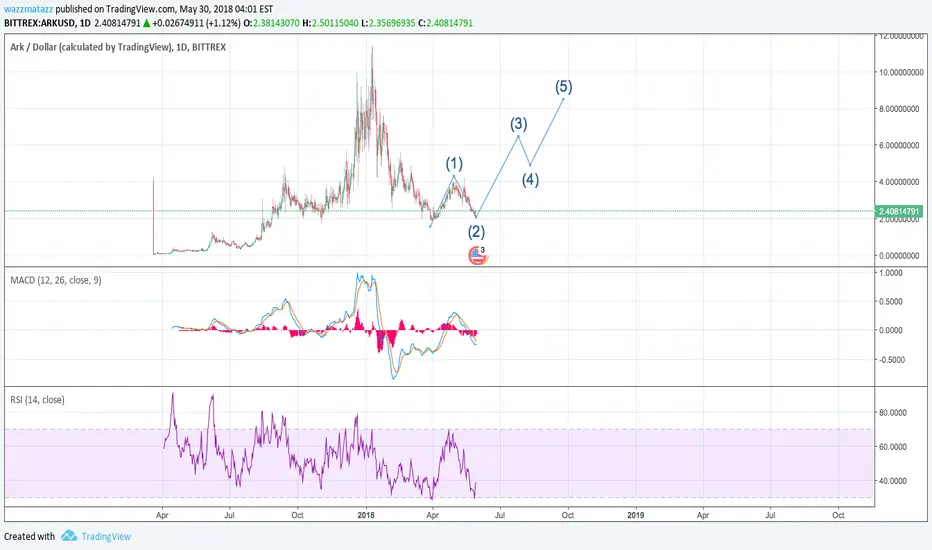
. ARK/DOLLAR is in a range bound and the beginning of uptrend is expected.
. The price is above the 21-Day WEMA which acts as a dynamic support.
. The RSI is at 51.
. The RSI downtrend & The price downtrend in the daily chart are broken, so the probability of the beginning of uptrend is increased.
Trading suggestion:
. There is still a possibility of temporary retracement to suggested support zone (1.4547 to 4.4910). if so, traders can set orders based on Price Action and expect to reach short-term targets.
Beginning of entry zone (1.4547)
Ending of entry zone (4.4910)
Entry signal:
Signal to enter the market occurs when the price comes to "Buy zone" then forms one of the reversal patterns, whether "Bullish Engulfing" , "Hammer" or "Valley" in other words,
NO entry signal when the price comes to the zone BUT after any of reversal patterns is formed in the zone.
To learn more about "Entry signal" and the special version of our "Price Action" strategy FOLLOW our lessons:
Take Profits:
TP1= @ 1.9008
TP2= @ 2.5293
TP3= @ 2.8638
TP4= @ 3.5292
TP5= @ 5.0388
TP6= @ 6.2557
TP7= @ 7.4755
TP8= @ 9.2089
TP9= @ 11.4100
TP10= Free
ARKUSD trade ideas

A trading opportunity to buy in ARKUSDTechnical analysis:
. ARK/DOLLAR is in a range bound and the beginning of uptrend is expected.
. The price is above the 21-Day WEMA which acts as a dynamic support.
. The RSI is at 51.
. The RSI downtrend & The price downtrend in the daily chart are broken, so the probability of the beginning of uptrend is increased.
Trading suggestion:
. There is still a possibility of temporary retracement to suggested support zone (1.4547 to 4.4910). if so, traders can set orders based on Price Action and expect to reach short-term targets.
Beginning of entry zone (1.4547)
Ending of entry zone (4.4910)
Entry signal:
Signal to enter the market occurs when the price comes to "Buy zone" then forms one of the reversal patterns, whether "Bullish Engulfing" , "Hammer" or "Valley" in other words,
NO entry signal when the price comes to the zone BUT after any of reversal patterns is formed in the zone.
To learn more about "Entry signal" and the special version of our "Price Action" strategy FOLLOW our lessons:
Take Profits:
TP1= @ 1.9008
TP2= @ 2.5293
TP3= @ 2.8638
TP4= @ 3.5292
TP5= @ 5.0388
TP6= @ 6.2557
TP7= @ 7.4755
TP8= @ 9.2089
TP9= @ 11.4100
TP10= Free

ARK, more drops are coming.ARK is losing -3.40% in the last 24 hours and its future in the short term looks quite Bearish, buyers couldnt sustain the bull momentum of the previous day and the price is sustained at this time by the Pivot S1. There is a possible short entry if the price touches the uptrend line in the short term and this touch becomes a breakout, from there we could see considerable drops.

ARKUSDNo interest, the blue rectangle is sell zone. price has to trade above that for possible bullish move. As long as it's not taken out, forget the longs.

A new trading opportunity to buy in Ark. Don't miss it....Technical analysis:
. ARK/DOLLAR is in a Range Bound and Beginning of uptrend is expected.
. The price is below the 21-Day WEMA which acts as a dynamic resistance.
. The RSI is at 43.
Trading suggestion:
There is a possibility of temporary retracement to suggested support zone (2.88 to 1.77). if so, traders can set orders based on Daily-Trading-Opportunities and expect to reach short-term targets.
. Beginning of entry zone (2.88)
. Ending of entry zone (1.77)
Entry signal:
Signal to enter the market occurs when the price comes to "Buy zone" then forms one of the reversal patterns, whether "Bullish Engulfing" , "Hammer" or "Valley" , in other words,
NO entry signal when the price comes to the zone BUT after any of reversal patterns is formed in the zone.
To learn more about "Entry signal" and the special version of our "Price Action" strategy FOLLOW our lessons:
Take Profits:
TP1= @ 4.05
TP2= @ 4.90
TP3= @ 5.45
TP4= @ 7.36
TP5= @ 9.13
TP6= @ 11.41
TP7= Free

Ark :- Daily Chart AnalysisArk :-
Good buying seen yesterday after prices took support at our moving average.
Ark would soon be into double digits and in the higher 20's.
Load up and average as prices go lower.

ARK x NOAHSOne of the few undervalue cryptos below 5$. Again, i was late, but it's still pretty damn better than never and missing the fuckin rocket to moon.

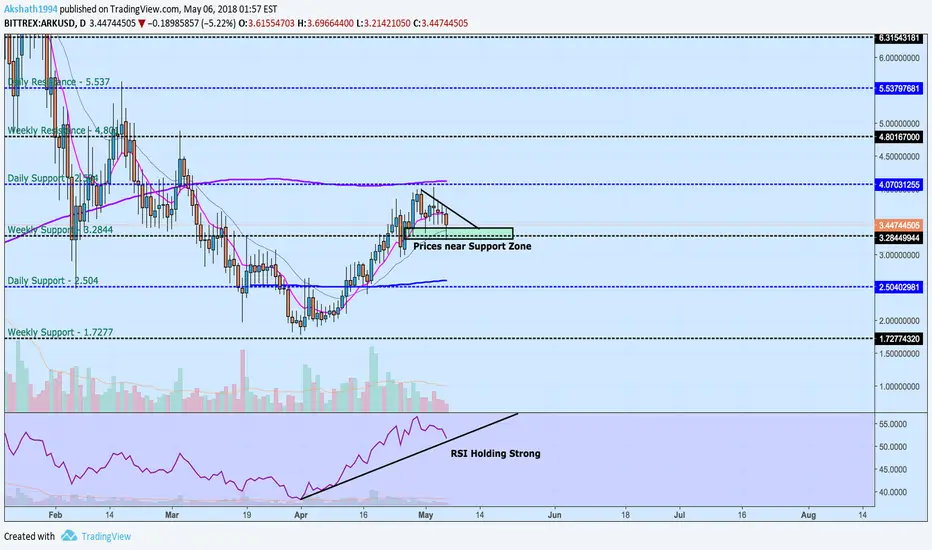
ARK :- Daily Chart AnalysisArk has moved up all the way from 2.14 to 4 since we started buying.Prices have cooled off for now which is good in order to start the next leg of the rally.
Keep in mind prices are now near support zone and also the RSI uptrendline is well placed to be touched and move back up with a bounce.
Wait and watch period has begun as you can see we still a need a close above the downtrendline.:dollar:


Ark :- Target Achieved Ark :-
Prices have achieved the target zone of 3.50.
Long positions had beem initiated at 2.04.
Profit Percentage :- 75%
:grin::dollar::dollar::smiley::+1:


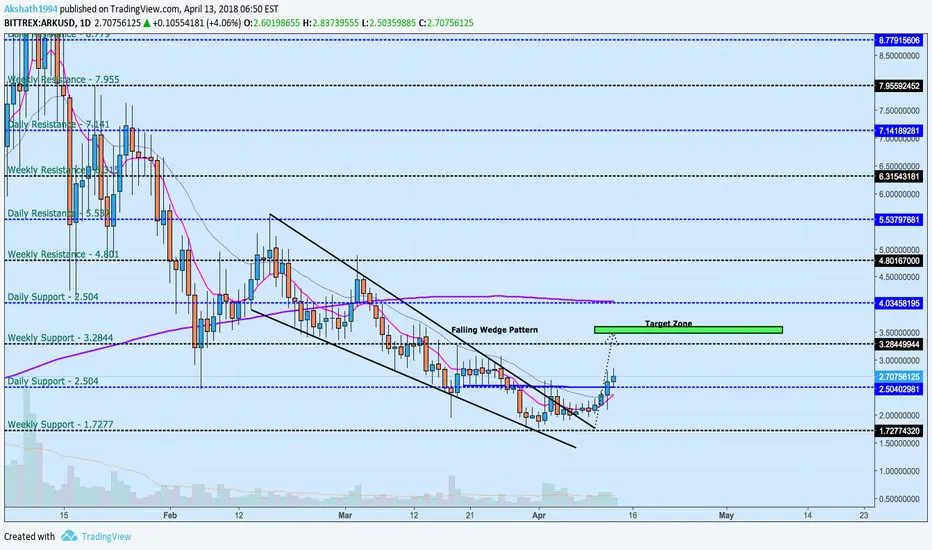
ARK :- Wedge Target ZoneArk :-
1.Falling Wedge Breakout and Target Achievement is currently in progress.Price have taken support at the daily demand zones of 2.504.
2.Volume support on the green candles are visible too and moving averages are currently supporting the price upmove.
A break above 2.92 would take us to 3.5 in the next few candles

Another One, ARK/USD long opportunity!Daily
Bouncing off major support zone @ $2-$2.20, priced formed a new high with resistance @ $2.85. March 3rd (lower high) has been taken out, awaiting price to form (higher low). A daily candle that close above $2.85 and Ark will pick up with momentum.
4Hour
Shifting over to our pattern timeframe we can see a minor correction is in place. As this analysis is being written price is sitting @ $2.60 with the open a of anew 4hour candle. If price holds @ this level wait for break and close above $2.70 on the 4hour for entry. Another possible entry is waiting for the potential bounce off our support @ $2.35 zone
Hourly
Finally looking at our trigger timeframe we see intraday price is looking bearish. Our support @ $2.35 looks like it will be visited in the near future.A bounce off this level is the ideal entry, not only bouncing off our drawn support but trendline as well.
Target 1: $3.00
Target 2: $3.75
Target 3: $7.00
Target 4: $10.00
Target 5: $15.00
Target 6: HODL
*Conclusion*__
* Buy: Wait for bounce @ $2.35 or break and close above $2.70
* Sell: Por Que?
We spend our days following the patterns, technicals and essentials of the
present most sultry data about Bitcoin, Ethereum, ICO's and different Altcoins,
and burrow through all the messiness to discover just the best data for our perusers!
In the event that you need the best cryptocurrency to buy / news conveyed
straight to your inbox.


ARK :- Bullish upmove in place Ark :-
As previously mentioned Ark will be heading to our target levels of 3.5
A bullish move has already begun and prices could head back to daily support levels @ 2.5 before we move towards 3$
10$ + levels will be seen this year itself.
Ark :- Falling Wedge Breakout Pattern Ark :-
1.Ark has broken out of the falling wedge and has held on to the moving averages for now as well.Prices are clearly heading higher from all the way to 2 to now 2.35
2.Ark has begun heading to the falling wedge target of 3.5 and over the next few weeks of green candles we will move towards those same levels.
3.A preliminary bullish move over 2.50 is required to see a further upmove eventually.

ARK :- Falling Wedge Ark (ARK) :-
1.A Falling wedge pattern is currently in the making and the price must break above 2.61 before we can confirm the move to the next weekly zone of 3.28.
2.Volumes are increasing on the green candles which confirms that buyers are heading into ARK at lower prices.
3.Go Long on the breakout for a price target closer to 3.51.(97% Return)

ARK - Daily Analysis Ark has broken out of our previous down trend line and we could be headed to 3.28 which is a weekly resistance level.
Price could hit that level and stagnate for a bit as its an area of major confluence of the parallel downtrending channel too.
A 30% upside is what Ark is in process of completing.
"Target :- 3.2844"

LONG TERM TARGET IS $18. My bias on Ark Coin is LONG , potentially up to highs of $18 this is long term target might I add.
We're currently approaching our $2 support zone , if we violate this trend line and touch our support zone we could then be in a rocky downwards trend, however if we hold current prices and bounce off our ascending trend line we could penetrate our resistance zone at $5(80% Gain) & also $8(165-180% Gain) .
LONG TERM TARGET.
My long term target is $18 which is around a 500% Gain!
I'd get in on this crypto now to be fair as insurance , if prices shoot to ATH, then we're covered however if prices go even lower, we're getting a discount on our future investments!
TP: $18

ARK/USD :- All set to Rocket in 2018ARK - One of the most fascinating cryptos out there for 2018.Great Team + Great Project + REAL WORK.
Ark is trading within a downtrending channel for the moment and looks like we could stagnate for quite some time before we get a pop back to 10$ regions.
I see us from Daily Support of 2.5 all the way up to 3.2844 for the moment.
Time based Movements to Weed out the Weak are currently in process.
