Keep an eye on $ARPA/USDTTarget mentioned
Noted: Not a financial advisor.
It's always recommended to carefully consider all the factors and conduct thorough research before making any investment decisions. I suggest seeking advice from a licensed financial advisor.
ARPAUSDT trade ideas

ARPA being rejected againARPA is being rejected again from the resistence zone. expect it to correct again.


$ARPA SHORTI wanted to share my thoughts on a recent market move involving a certain L1 coin. In my opinion, there was a clear signal to short this coin as it appears that the market makers were manipulating the books. This type of activity is not uncommon in the crypto world, and it's important to stay vigilant and do your own research before making any investment decisions.
If you take the time to look into this particular market maker, you may find that they have a reputation for being a "big grifter" in the market.

ARPAUSDT(ARPA Chain) Daily tf Range Updated till 12-05-23ARPAUSDT(ARPA Chain) Daily timeframe range. in this one volume is a concern gotta careful on the wicks it can trap peoples, but if you play level by level its cool. daily close above #0.05106 clear a path till #0.06577. closing below #0.05106 will lead it to lower levels.

Arpa | Looks Promising Here Arpausdt
On the wrdge of breakout incase if succesful breakout expecting 40-50% Bullish move short term

ARPA has big bullish triangleThe coin is in the game. At the moment, the instrument is in the top of growth, trading at increased volumes. The graph shows an accumulation whose maxima are at increased volumes, which statistically indicates the presence of a buyer. Potentially, I expect a local preload to the level with a further release of the price in the long. Target: 0.06$

ARPA will soon be rejectedHi, dear traders. how are you ? Today we have a viewpoint to SELL/SHORT the ARPA symbol.
For risk management, please don't forget stop loss and capital management
When we reach the first target, save some profit and then change the stop to entry
Comment if you have any questions
Thank You

ARPA/USDT WCA - Rectangle Pattern as a Reversal Introduction:
Hello and thank you for taking the time to read my post. Today, we analyze the ARPA/USDT chart on the weekly scale on the Binance exchange. We focus on a classic price pattern called the "Rectangle Pattern," which serves as a reversal indicator in this particular case.
Rectangle Pattern:
The rectangle pattern is a consolidation pattern that occurs when the price moves sideways within a defined range, creating clear upper and lower boundaries. This pattern suggests that the market is indecisive, and a breakout from the range can lead to a strong move in the direction of the breakout.
Analysis:
The ARPA/USDT chart shows that the head and shoulders pattern, with its head at the previous all-time high on 01/11/2021, marked the beginning of a downtrend. However, we have now transitioned from a downtrend into a sideways trend characterized by a well-defined rectangle pattern. The upper boundary is at 0.05403, and the lower boundary is at 0.02482.
This rectangle pattern serves as a reversal indicator, signaling that a close above the upper boundary could potentially initiate a new uptrend. It is also noteworthy that the price is attempting to move above the 50 EMA, another bullish indication. Being above the 50 EMA typically suggests a bullish environment.
Conclusion:
The ARPA/USDT weekly chart analysis highlights the rectangle pattern as a reversal indicator. Traders should closely monitor this chart for a breakout above the upper boundary, which could signal the beginning of a new uptrend. Until then, this chart remains a watchlist candidate.
Please note that this analysis is not financial advice. Always do your own due diligence when investing or trading.
If you found this analysis helpful, please like, share, and follow for more updates. Happy trading!
Best regards,
Karim Subhieh


ARPAUSDT is testing the key levelARPAUSDT is testing a dynamic support level around the 0.038 $ area, which is significant because it follows a bullish impulse.
Traders and investors are closely monitoring these levels, as they provide crucial information about the future direction of the market. If the price manages to hold the dynamic support level, it may continue its upward trend. However, if the support is broken, it could act as a new resistance level, indicating a bearish trend.
According to Plancton's rules, if the price of ARPAUSDT breaks the dynamic support and retests it as a new resistance, this would trigger a short selling opportunity. Short selling is a trading strategy used by traders to profit from a decline in the price of an asset. In this case, if the price of ARPAUSDT fails to hold the support level and turns into resistance, it would signal a potential reversal in the market, providing an opportunity for short-term traders to enter a short position.


$ARPA.038ish would be a nice bid
stoch turning up so just needs some volume and we should pop
not in this trade posting a request .. 70/30 probability of it break up imo
then start scaling into shorts or get sidelined and spend your profits and wait to long again

ARPA looks bullish This is not a financial advice at all, it’s for educational purposes only , please do your own research.

ARPAUSDTI dont know if it will pump like as i aspect on the chart. but if it will that will be crazy

Arpa | Buyers Activity Arpausdt
The support is not big in this place, but the pressure of buyers is high.Most probably price will reach resistance again, the next game will start from there, if the breakout comes then surely 50% bullish move is expected.
Consider the above Horizontal Line First Target for now.
Remember: We only give ldea's from our
experience and knowledge, it does not
mean that it will be 100% correct, the
market is always unpredictable, anything
can happen anytime.
Always trade with your own research and
knowledge. If You Are Satisfied With Our
Work Then Join.

ARPAUSDT Bullish ?all that upward movement has to be followed by another, and around this spot looks reasonable for me to buy some. But if the coin loses momentum in the next couple of days, I would probably leave it.
I hope this week to be the start of a long term bullish trend on ARPA..
Just my thoughts, not a financial advice.

Arpa Getting ready for Massive Breakout Can Give some Good returns In Midterm Incase Of breakout
Forming Symmetrical Triangle Incase Of breakout Expecting 350 to 400% Bullish Move

ARPA Triangle into TriangleThe coin has formed a cascade of several local resistance levels, behind each of which I expect to see an accumulation of liquidity (there are clearer levels on the spot chart). The trend is locally ascending and the passing volumes are greatly increased, which indicates the interest of participants in the instrument.

ARPAUSDT bullish??ARPA has been going down for a while now, but It has to take a breath and this looks just like the spot to do.
For a week or so I expect it to be bullish...
I don't really have any optimal trades tho,
I bought some and will keep an eye on it.
I'm not an expert so, I don't recommend to take a position without checking it yourself.

ARPA Chain almost completed bullish Gartley for upto 27.50% pumpHi dear friends, hope you are well and welcome to the new trade setup of ARPA Chain (ARPA) token with US Dollar pair.
Recently we caught more than 38% pump of ARPA as below:
Now on a 4-hr time frame, ARPA has formed a bullish Gartley pattern for another bullish reversal move.
Note: Above idea is for educational purpose only. It is advised to diversify and strictly follow the stop loss, and don't get stuck with trade

Riding the ARPA WaveBased on our technical analysis of ARPA's recent market behavior, we are taking a long position with a target of 0.0492. The cryptocurrency has exhibited a strong upward trend, supported by key technical indicators that suggest positive momentum in the short to medium term. As always, you should conduct their own research and exercise caution before making any financial decisions.

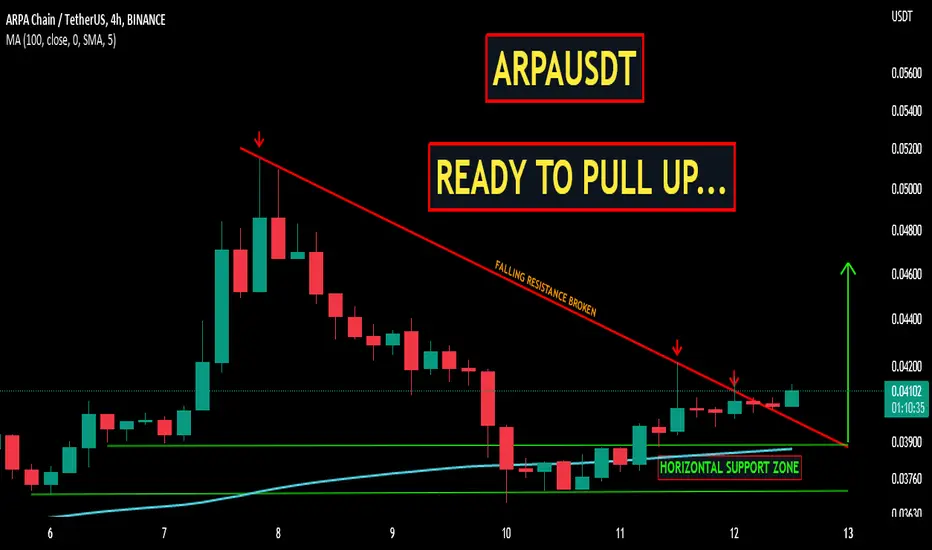
A ARPAUSDT | READY TO PULL UP...ARPA price has been converging with in a triangle. Now the price has broken above the triangle. The bulls have a strong horizontal support zone .As long price is holding a support, bulls will remain in control.
Manage your levels accordingly.