ARUSDT Forming Descending ChannelARUSDT is showing a promising setup as it begins to break out of a clear descending channel pattern on the daily timeframe. The current chart indicates strong potential for a bullish reversal, with price action approaching key breakout levels supported by healthy trading volume. This technical forma

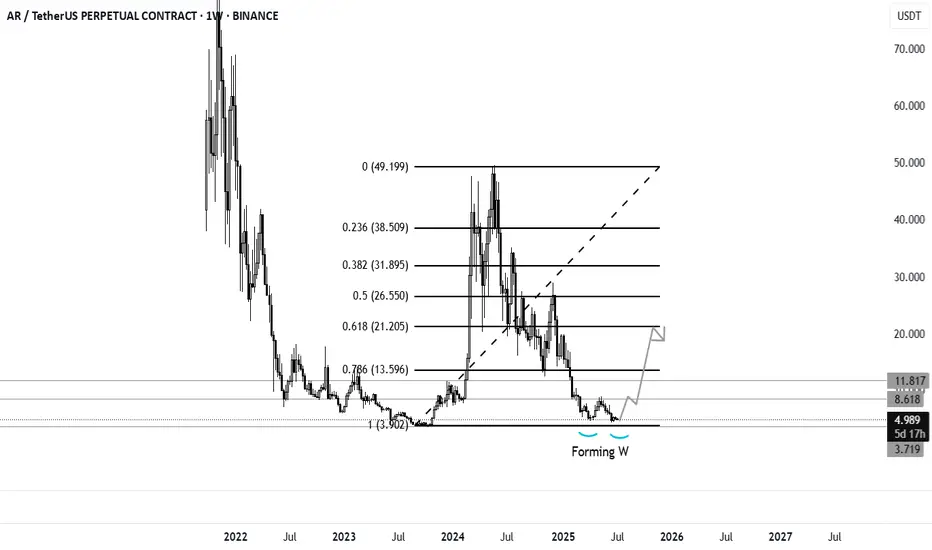
AR forming W. Good news for long term till OCTSimilar to my ARKM analysis both charts are very much similar. AR will be growing till OCT 2025.
Keep it simple and long term.
Guys don't joke, this is about to explode don't hunt -10%Guys don't try to catch lows, its ripe to explode literally any second.
People are aware coin will survive no matter the FUD.
People are aware this is primed for 500$-600$ price peakings.

AR Looks Bullish (1D)The AR symbol appears to be completing a double corrective pattern | the first part being a plapyonic diametric and the second part a flat. The green zone represents a demand area that could potentially push the price upward. Note that this type of setup is generally safer for spot trading, while fu

Arweave—Bullish Bias Confirmed (Altcoins Bull Market As Promise)Three weeks ago I told you a very strong bullish wave was approaching the altcoins market. It is here, confirmed. The rest is just too easy...
Tell me... Can you see this?
Tell me you can see this. I know you can.
Tell me you can see the end of a correction, the bearish wave.
On the 5th of June t

ARUSDT 5D AnalysisAR ~ 5D Analysis
#AR This is the lowest support for now. Buy back from here with a short term target of at least 15%++ from this support.

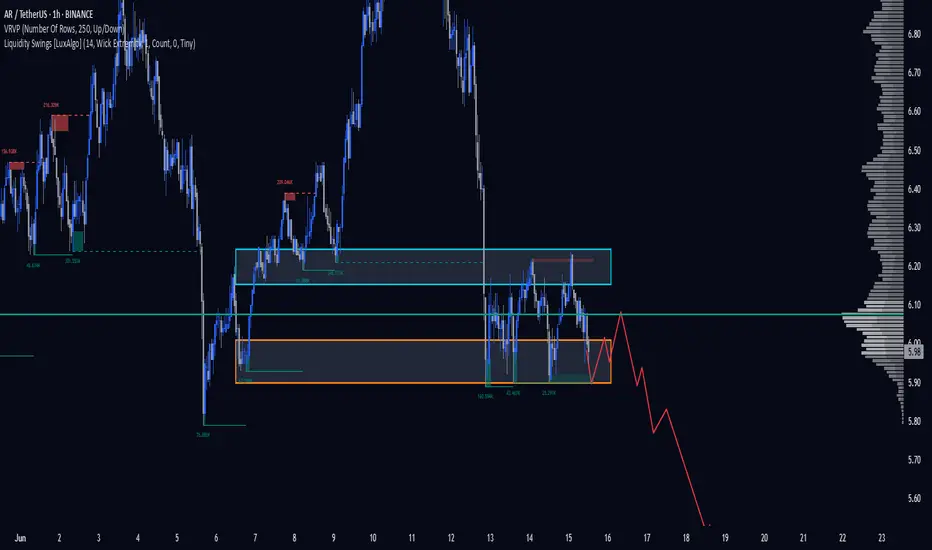
AR 1H. $5.90 Is the Last Line of Defense. 06/15/25BINANCE:ARUSDT If we fail to hold the $5.90 level, this asset could crash hard — potentially entering a deeper downtrend.
DYOR.
AR - Super Bullish LONG SET-UPBINANCE:ARUSDT
2️⃣ 𝐀𝐑/𝐔𝐒𝐃𝐓
AR is flirting with a trendline breakout after a long downtrend. A clean move above could ignite a rally toward $16, eyeing a sharp 123% upside. Setup looks primed

AR/USDTAR/USDT analysis on the hourly time frame. The analysis is based on trend analysis, support and resistance. The expected outcome is an upward trend.


See all ideas
Summarizing what the indicators are suggesting.
Oscillators
Neutral
SellBuy
Strong sellStrong buy
Strong sellSellNeutralBuyStrong buy
Oscillators
Neutral
SellBuy
Strong sellStrong buy
Strong sellSellNeutralBuyStrong buy
Summary
Neutral
SellBuy
Strong sellStrong buy
Strong sellSellNeutralBuyStrong buy
Summary
Neutral
SellBuy
Strong sellStrong buy
Strong sellSellNeutralBuyStrong buy
Summary
Neutral
SellBuy
Strong sellStrong buy
Strong sellSellNeutralBuyStrong buy
Moving Averages
Neutral
SellBuy
Strong sellStrong buy
Strong sellSellNeutralBuyStrong buy
Moving Averages
Neutral
SellBuy
Strong sellStrong buy
Strong sellSellNeutralBuyStrong buy
Displays a symbol's price movements over previous years to identify recurring trends.