ARUSDTWe can attempt to buy ARUSDT from specified level as it make ascending symmetrical triangle pattern (Continuation pattern) , also there is no bearish divergence indicate that it move upward .
SL , TP mention in chart.
ARUSDT trade ideas

$AR SHORT1/3.5 RR setup looks very high probability, cause CRYPTOCAP:BTC can go down 3% more so altcoins too, I see 10 % minimum downside for altcoins, take risk here on NYSE:AR

ARUSDTARUSDT was trading under the declining trendline. The price was reacting well the support and resistance of trendline
Currently the price has given the breakout from declining trendline with confluence to strong bullish divergence and now seems like the bulls are getting ready for some strong upside movement.
If the bulls sustain to upside the optimum target could be 50
What you guys think of this idea?

📊-ARUSDT update: It's at a critical level "📊 ARUSDT update: It's at a critical Level, hitting the top of its parallel channel and resistance. 📈 RSI indicator is signaling overbought conditions. 🚩 Potential for a trend reversal or breakout ahead! Stay vigilant! 💡 #CryptoAnalysis #TradingSignals #RSI"

AR ANALYSIS (4H)AR has a strong resistance range ahead.
A downward reversal pattern appears to be forming.
When you reach the supply range, you can look for sell/short positions.
Demand range can be a good place to save profit.
Closing a daily candle above the invalidation level will violate the analysis
For risk management, please don't forget stop loss and capital management
When we reach the first target, save some profit and then change the stop to entry
Comment if you have any questions
Thank You

Arweave | Very Strong Weekly SessionWe like the bottomed out pairs.
We like low pricing.
We like low risk.
When the action is ongoing, the risk is higher.
Charts like this one: get out right after getting in.
Charts at the bottom: buy and hold is easy.
Arwave (ARUSDT) is moving above EMA100 weekly with a super strong RSI.
➖ Long-term, means the entire bull-market.
➖ Short-term, means the bullish wave that is happening now.
Short-term it can grow strong and then retrace.
Long-term it can produce higher highs and higher lows.
I see potential for additional growth as the week will close strongly bullish.
Just keep in mind that this pair has been moving up since October 2023. A retrace can start any day, anytime.
Thank you for reading.
Namaste.

ARUSDT(Arweave) Daily tf Range Updated till 28-04-24ARUSDT(Arweave) Daily timeframe range. trying to get over 35.610 for a while now. need a little bit more volume to get cross that. if it can than way open till 48.545. if not than recent support at 21.742.

Huge Inverse H&S PatternInverse head and shoulders pattern over the entirety of April. Resistance line has been broken with a sign of strength. Target is previous local highs at $46.5, where I expect possible range-bound action before another eventual breakout. ***Not financial advice, DYOR.***

AR NEXT MOVEDisclaimer: Before proceeding, please note that the following information is based on technical analysis and should not be construed as investment advice. Always conduct your own research and, if necessary, seek advice from a financial professional.
Folks, let's delve into what I've been observing in recent market movements. After a period of analysis, I've noticed an intriguing pattern. First, we witnessed a descending wedge pattern, followed by a false breakout to the downside. Then, there was the formation of a double bottom, suggesting strong institutional interest in a particular zone. This pattern was followed by a reversal that has already reached the target of the wedge breakout.
But the story doesn't end there. Recently, I've observed the formation of a new parallel channel, initiated from April 21st. This was accompanied by the creation of a new descending wedge, which, although with a shorter duration, has already reached the projection after its breakout.
Based on these observations, I'm predicting that we're in a wave 3 of impulse. In a short period of time, I anticipate a correction to the bullish zone, with targets between 35 and 32, and a final target around 41. On a broader horizon, I'm projecting a total target around 72.
Now, regarding how to act upon all of this: my suggestion would be to consider buying in the zones indicated on the chart. Upon reaching the first target, it's prudent to realize between 60 to 70% of the position and move the stop to the entry zone. After hitting the second target, you may realize another 20% of the position, leaving the remaining 10% for the third target.
Once again, these are solely my analyses and should not be taken as guarantees of success. The financial market is volatile, and there are always risks involved. Always be prepared and conduct your own analyses before making any investment decisions.

AR SELL LIMIT 😎♻️😎♻️😎♻️Hi dear traders
The price has formed bearish pattern.
We can open short position with suitable R/R.
Let's see what happens
This is not financial advice ( DYOR )
Good luck

ARUSDT 12H#AR has broken the falling wedge pattern and EMA100 on the 12H timeframe. RSI and MACD are showing bullish momentum. Targets are:
$32.613
$38.310
$47.518
Supports are:
$28.009
$23.405

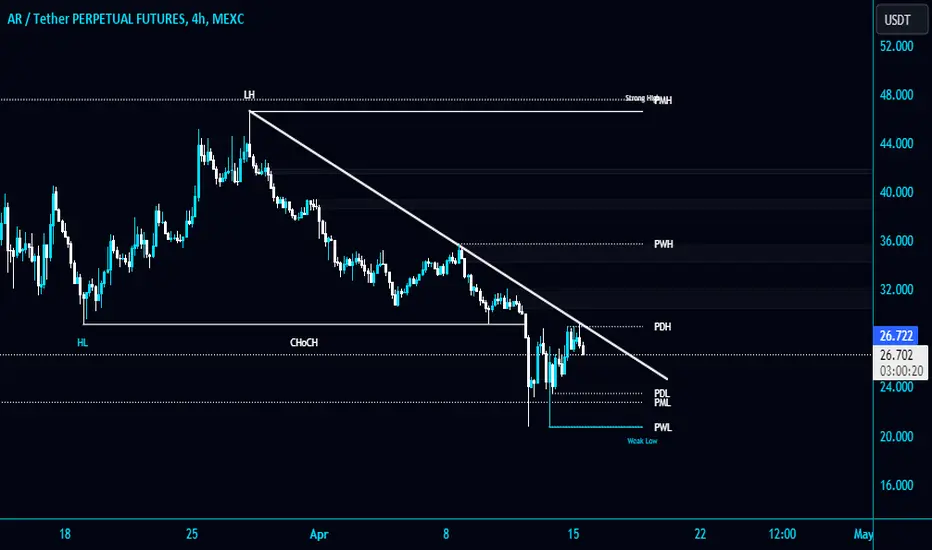
#AR/USDT is heading towards a Diagonal Trendline in 4-Hour TF!#AR/USDT is heading towards a Diagonal Trendline in 4-Hour TF!
NYSE:AR needs to clear the Trendline along with the PDH $25.4 resistance level. #ARUSDT's strong support level is $22.7. The next local resistance level is PWH $35.725.

#AR/USDT is rejecting from the Diagonal Trendline in 4-Hour TF!#AR/USDT is rejecting from the Diagonal Trendline in 4-Hour TF!
The Trendline reacting as a resistance. NYSE:AR needs to break the Trendline to gain the bullish momentum. The local resistance level is PWH $35.88. The strong support level is PML $22.7 for #ARUSDT.
Ar Arweave #AR $Ar Areweave has found support so far at the $21-$23 range which coincides with support that has worked earlier this month as well as in prior years such as February 21st, 2022, and August 23rd, 2021.
However, the wicks through it look somewhat worse this time around and if we get any more pullbacks from CRYPTOCAP:BTC & CRYPTOCAP:ETH with anymore escalation of War etc. issues in the middle east i would be watching for us to drop to the $15-$16 range.
We have currently fallen below the ema/ma's of 9,20,& 50.
The 180 would be next which coincidentally is currently in the $16 range.
Up above us I would be watching for Resistance to begin in the $29-$30 area and if we get through that then things begin to look Gucci again.
I've purposely given you the same chart and layout but on two different time frames to help newer traders coming into this cycle see how different things can look on a daily vs a weekly time frame.
I think that this can really help speed up learning for many and to open their minds to variables.
As you see the daily can easily in this case look much more instantly bullish and give you the greater feeling of FOMO #Fomo to jump in. Whereas the weekly can give you more of a tactical view and help with your approach being so.
Hopefully some of you find this chart helpful during this stressful pullback/flush that I'm aware has really beaten down and or killed many portfolios for traders.
I've fallen off on posting/sharing my charts these last few months while I was trading ALOT myself and on multiple platforms and various ideas. However, during these more stressful times I will try and stay more active with updating what community I have.
For my birthday without cause or warning X shutdown my larger account @RareBreedOG so I'm starting over fresh with almost no followers now for the algorithm. That being said I would greatly appreciate help with you hitting the like /Follow/share buttons as much as possible if you find these charts helpful at all or even just want to help me rebuild my following after getting Fu**ed by X. For this reason, I don't plan to pay for a checkmark this time around either, but you can all help give me reason to keep sharing and not just leave to other platforms.
Everyone stay safe and trade wisely and be careful with leverage in these uncertain times.

AR is making W pattern.NYSE:AR is making W pattern on 1hr tf and also made double bottom on 15m tf.
W pattern most of the time breaks upwards. So I'm trying this long setup with tight stoploss and quick gains.
Let's See!!
#nfa #dyor #aqeelonline #ar #btc

AR TO MAKE ANOTHER BULLISH RALLYAR is trading above the trendline and making structure like TRB few months ego, if this happens this would be the biggest opportunity to grab it initially.

📊#AR has the opportunity to form a cup-handle structure📈🧠We have been consolidating for a long time after achieving the daily level target. From a structural point of view, we have the opportunity to form a cup-and-handle bullish structure near the buying zone. If the bullish power continues, we have a probability of breaking through the historical high.🚀🌕
Let's see👀
🤜If you like my analysis, please like 💖and share it💬
💕 Follow me so you don't miss out on any signals and analyze 💯

Testing Support at $33AR is presenting a clear narrative on the 4-hour chart. With the current price at $33, AR has shown some weakening in its bullish momentum, as indicated by the price movement converging with a dynamic resistance level and falling back.
The chart details a point where the price has lost its upward drive and indicates that this could be a pivotal area for future price action. The Bollinger Bands show that the price has pulled back from the upper band and is now closer to the lower band, which could act as a short-term support.
The volume is moderate at 53.6K, which doesn't suggest an overwhelming market consensus in either direction at this time. The Moving Average Convergence Divergence (MACD) histogram has ticked up slightly, yet the MACD line remains below the signal line, indicating that the bullish trend may be running out of steam.
The Stochastic Oscillator, while not in the oversold territory, is trending downwards, suggesting that the momentum could be shifting. Moreover, the Relative Strength Index (RSI) is hovering around the midpoint, aligning with a neutral market sentiment without strong bias to either buying or selling pressure.
Given these indicators, traders might be cautious, watching to see if the local support level holds, which could offer a rebound opportunity, or if the price will break through this support and explore lower levels. The area marked as 'Local Support' on the chart will be particularly important; if this level doesn't hold, it could lead to further declines. Conversely, if the price maintains above this support, it could signal a potential recovery or consolidation phase.
The intersection of these technical elements—price action, indicators, and support/resistance levels—will guide traders' decisions in the near term.

Arweave thoughtsBINANCE:ARUSDT BINANCE:ARUSDT.P
www.tradingview.com
Arweave is reaching a good distribution area around the 32$ mark
If it broke down the 32$, the next target is going to be around the 22$ mark
Both are good areas for accumulation if you're bullish on AR weave

AR/USDT Double top, Potential back test on the demand or support💎 AR has recently undergone notable market dynamics, characterized by the formation of a double-top pattern. This pattern typically signifies a bearish trend reversal, with the target set at the demand area.
💎 However, if AR manages to break above the previous high at $47.5, it would invalidate the pattern, indicating a potential continuation of the upward movement toward the strong resistance area.
💎 Should the double top pattern prove valid, AR is likely to back-test the demand area around $25.7 - $22. This demand area holds significant importance, as failure to bounce from here and continue the upward movement would result in further downward pressure, potentially leading to the support area.
💎 Bouncing from the support area is crucial for AR, and it must reclaim the price above the demand zone at $25.7. Failure to do so would signify continued downward momentum, with the price likely to decline further.


🟢 AR Trade Plan: Bullish Pullback Strategy 📈🚀🎯 Entry Point:
Spot buy between $33 to $38 during the anticipated short-term pullback into the buy zone.
🎯 Take Profit Levels:
First target: $54
Second target: $69
🛑 Stop Loss:
Set at a daily close below $28 to manage downside risk.
📊 Strategy Rationale:
Capitalizing on AR's strong performance and potential pullback opportunity.
Targets set at key resistance levels for profit-taking.
Stop loss placed below significant support to mitigate losses in case of a reversal.
📉📈 Note: Stay vigilant for entry opportunities and adjust strategy based on price action. Monitor closely for breakout confirmation. #AR #TradingStrategy #BullishPullback 🟢📊

ARUSDT UpdateAR has beaten expectations for it's falling wedge breakout. It is the storage solution for Solana, so I guess it has been dragged along with SOL's massive run. Most likely scenario from here IMO is that the market will treat this move as the C wave of a massive ABC correction from the project launch, with a target of around $80. This would represent bearish sentiment but this is commonly the market assumption for projects until they prove they are not slowly making their way to zero! Arweave would have to complete the C-wave, retrace and then go on to make a higher high next bull market for the long-term bull case to be proven... Alternatively, if it breaks $150 this cycle, we would then assume that this is actually a bullish continuation from last cycle's highs as part of a wave 3. We will have to wait and see...
