ASTRUSDT.PASTRUSDT.P is in bearish trend.
Potentially printing LH and LL.
No sign of reversal here.
We wait and watch for the breakout of last LL.
ASTRUSDT trade ideas

ASTR NEW BREAK OUT OF TRENDThank you for reading this update.
Depending on our study we see that ASTR has a good chance of volume increase.
These updates depending on day trade, And the market should confirm with time the right market way since the market shows a new break of trend.
#Nottradingadvice
#For Day traders take always profits when the market increase
#Expect nothing from the markets, but follow what it shows.

ASTR 0.081 | DOT's Showcase to dAPPSwe invest in people and Sota Watanabe is as close to Satoshi Nakamoto
perhaps in time we shall find out

Astar great coinLooking for 40% upside if makert conditions allows so.. no structure swing.
Retest in progress
NFA

ASTR Astar Coin Price Prediction🔥 Price on the 4H chart might come at these support area and we might get a potential bounce🔥
Potential bounce areas for Buying 0.0906 and 0.0738
👉 Follow me for more real time opportunities.
Share your Thoughts if you have any?

ASTR/USDT possible next move ? 👀 🚀ASTR Today Analysis💎 Paradisers, turn your attention to #ASTRUSDT as it’s gearing up for a pivotal moment. Currently poised near a support zone, it is hinting at its next potential market direction.
💎 A recent look at its market activity reveals a rejection from a strong resistance zone, followed by a significant downward trajectory. Now, MOEX:ASTR is at a juncture where it could unveil its next move.
💎 If #ASTAR holds steady at the support level of $0.0787, we might witness a bullish continuation from this point. Alternatively, should it dip below this level, the focus shifts to the next support at $0.0766, from where a bullish resurgence is possible.
💎 However, it gets more intriguing. If #ASTR breaks through the $0.0766 support zone, the market sentiment could sway towards the sellers, potentially leading to further downward movement. 🌴💰

Astr Your Opportunity to Build Wealth: Unlock Crypto's Hidden**AST Coin Fundamentals**
AstrCoin is a decentralized open-source project that aims to provide a secure and efficient platform for inter-blockchain communication. The coin is used to incentivize users to participate in the network and secure its operations. AstrCoin has a number of key features that make it a promising project, including:
* **Decentralized:** The AstrCoin network is not controlled by any single entity, making it censorship-resistant and secure.
* **Open-source:** The AstrCoin code is open-source, allowing anyone to review and contribute to the project.
* **Scalable:** The AstrCoin network is designed to be scalable, allowing it to handle a growing number of users and transactions.
**Recent News**
* **AstrCoin Integration with Cosmos SDK:** AstrCoin has been integrated with the Cosmos SDK, a modular blockchain development framework. This integration will allow AstrCoin to be more easily integrated with other blockchains and will provide a number of benefits, such as increased interoperability and security.
* **AstrCoin Staking Rewards:** AstrCoin has implemented a staking mechanism that allows users to earn rewards for locking up their ASTR tokens. This mechanism will help to secure the AstrCoin network and will also provide a source of income for ASTR holders.
* **AstrCoin Community Growth:** The AstrCoin community is growing rapidly, with a number of new members joining the project every day. This growth is a sign of the project's strong potential and its ability to attract users and developers.
**Disclaimer**
Please note that the information in this article is not financial advice. You should always do your own research before making any investment decisions.

ASTR/USDT Bullish Breakthrough on the Horizon? 👀 🚀 ASTR 💎 Paradisers, prepare for an intriguing opportunity with ASTRUSDT as it showcases a potential to surge past the supply zone.
💎 Observations reveal ASTRUSDT's consistent pattern of breaking above a descending trendline, only to face rejection at the supply level. Currently, the momentum is building, suggesting a strong chance for ASTRUSDT to breach the supply ceiling and target the next major supply zone.
💎 Should ASTRUSDT struggle to overpower the supply, we anticipate a bullish rebound from the current demand level. Reinforcing this bullish outlook is the RSI divergence, which upon close examination, indicates a bullish divergence.
💎 However, a fall below the demand level could trigger a significant bearish descent towards the support level. Stay vigilant and monitor these key levels closely.

ASTR LONGNASDAQ:ASTR Long
Entries: $0.06105 - $0.05883
Stoploss: 4H Close Below $0.05629
Final Target: $0.10780

ASTR target 0.1612h time frame
-
ASTR is creating two double bottoms, white and yellow circles which are marked on chart. This is a strong sign of bottom structure. Combining Fibonacci Projection with Structural resistance, we can have three targets as below. However, considering the potential dump of market, ASTR might reach 0.1~0.12 only then pull back with whole market, but we can still expect higher target when bull coming in 2024.
TP: 0.1~0.12 / 0.166 / 0.2
SL: 0.037

Long ASTR
ASTR has just finished the last week with a good candle: high volume and breaking the MA200D (a strong support).
When looking at ASTR/BTC pair (see below screenshot), we can see hidden bullish divergence.
A long set-up is proposed as in chart with a RR=5:1.

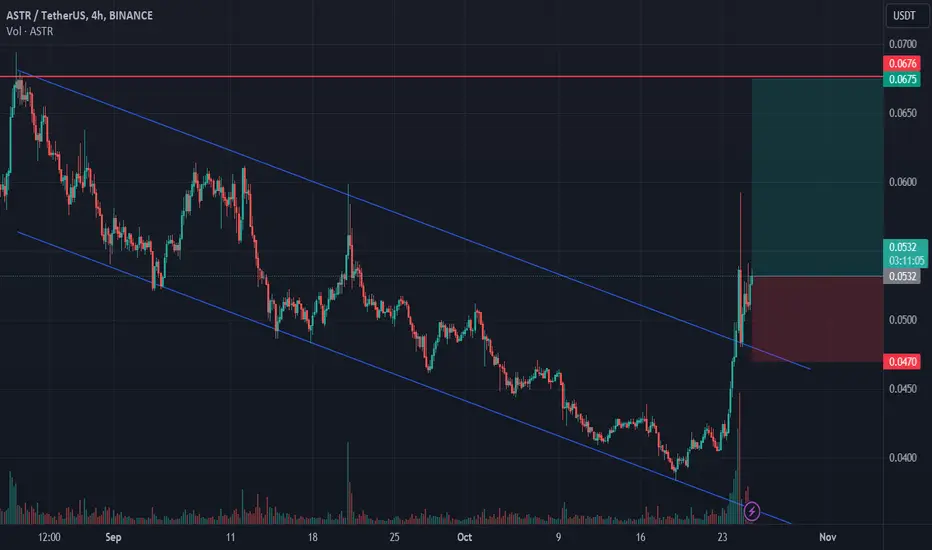
ASTR longASTR broke trough off the upper boundary of descending channel. Bullish movement to resistance level at 0.0675 is expected to happen.
ASTR/USDT Switch to Upward Momentum ??? Astar Analysis Today💎 ASTR has certainly captured our interest. Currently, ASTR is navigating within a descending channel formation, recently experiencing a notable upward surge following a bounce off the channel's support trendline. There's potential for ASTR to climb further to challenge the resistance trendline, as indicated by the robust green candle.
💎 However, merely reaching this point isn't enough; ASTR needs to decisively break out of the descending pattern to validate a bullish momentum and sustain its ascent. Success in this endeavor could see ASTR targeting the supply zone and even the significant supply area beyond.
💎 Conversely, if ASTR faces rejection at the resistance level, it may retreat for a retesting phase near the upcoming demand zone, aiming to gather strength for another breakout attempt. The scenario turns bleak if, during retesting, ASTR fails to demonstrate a strong rebound or faces rejection at the demand zone, leading to a breach below. Under these circumstances, ASTR might extend its downward trajectory, seeking the next level of support.

ASTRThe coin looks pretty interesting to buy
We can expect another bounce from the current level
You can buy it to hold on SPOT or find the better entry ti Long it.

ASTRUSDTASTRUSDT was trading in descending parallel channel and recently it seems like the sellers are bit exhausted now and bulls took the charge and now has given the breakout from descending channel.
Currently the price is forming a local support around 1.90 region.
Will the bulls take charge again continue for leg higher?
What you guys think of this idea?

#ASTR/USDT is forming the Descending Channel Pattern in 4-Hour T#ASTR/USDT is forming the Descending Channel Pattern in 4-Hour TF!
MOEX:ASTR reclaimed the PWL $0.4085. Wair for Previous high $0.427 breakout to open a long position. I am not opening a long until it breaks that level.
The local support level is PDL $0.3835.

ASTRUSDT buy signalThis is a short-term trade setup, and we think it also might be the beginning of a large uptrend. So we are long with good RR.

ASTRUSDT, SHORT TAKE PROFIT AND NEXT RIP IDEAI am short ASTR, looking to take profit at the highlighted area and will be adding more at the highlighted area.

ASTRUSDT Uptrend Within the Ascending Channel💎For over 2 months, starting from the end of June, #ASTRUSDT has displayed consistent upward movement, firmly entrenched within an ascending channel. However, a pivotal development occurred on August 23 when the price decisively breached the upper boundary of this ascending channel. This breakthrough hinted at the potential for an accelerated uptrend. Nevertheless, in the wake of this upside breakout, a corrective phase unfolded over the course of 3 weeks, and it appears to be an ongoing process.
💎What demands our attention at this juncture is the current price testing the lower boundary of the channel once more. This test is occurring in proximity to a critical demand zone, which interestingly served as a supply zone in the past. In the realm of probabilities, mathematics speaks volumes, and buyers should be keenly aware of the emerging risk-to-reward opportunity.
💎As long as the price remains above the demand zone, the MCP team anticipates a resurgence in price. A robust confirmation of an uptrend, in our view, would manifest with a break above the recent high at $0.0614. Such an event would trigger our quest for an opportune entry point. Subsequent to the breakout, we anticipate the price gravitating towards one of the double Fibonacci resistance levels, as depicted on the chart. Notably, the second resistance level aligns with the upper boundary of the extended ascending channel and could serve as a profit-taking region should the uptrend persist.
💎Paradisers, we remain vigilant for the establishment of a new higher high, a development that would likely usher in the next phase of the uptrend.

ASTRUSDT... ignition, get ready to the moon!~We are predicting ASTRUSDT to either bottom out, or be very very close to the bottom. In either case the risk/reward setup is exceptionally attractive!

ASTER | Possible upward movement I think there is a cup and handle pattern that promotes positive forward movement
The trade was opened with a tight stop loss to reduce the impact of violent fluctuations in the market.
Entry : 0.059
Stop : 0.054
TP1 : 0.065
TP2 : 0.071
TP3 : 0.077

ASTR decision pointFractal is at the decision point, if able to break out the downtrend, next first target is very likely.
If trend is broken but held by the purple line, the downside targets activate.

ASTR Retraced and Now Back For Another JumpHere is My Study On ASTR.
Welcome to my channel! Here you'll find daily technical analysis ofthe latest trends in the crypto market. From Bitcoin to altcoins, I'lIl be sharing my insights and predictions to help you make informed decisions
about your investments. Follow me for the latest updates and join the conversation in the comments!
Crypto technical analysis uses past price history to predict future price. It's not a guarantee and shouldn't be relied on solely for investment decisions. Consider other factors such as market trends, economic strength and
information dissemination. Use with caution.
This Is Not A Finacial Advise
