$ASTR is readyThe consolidation phase of the market as of this writing simply shows that the market is just waiting for a trigger for NASDAQ:ASTR to blow up as a reaction in the upcoming announcement by Astar Network on the 13th of September. "SUPERNOVA" they it, might make the difference. We don't know the details yet, but one thing is for sure- they won't hype it if its nothing.
The normal trend is to sell on news, but if the news is very material- the market might become unstoppable. twitter.com
Caveat.
ASTRUSDT trade ideas

40% Uptick in Sight for ASTRUSDT ?💎 On the daily logarithmic chart, yesterday #ASTRUSDT showcased a precise bounce off its uptrend trendline. This behavior is consistent with the bullish trend that has been evident since June.
💎 The demand zone, which is of paramount importance, has remained steadfast. This zone is possibly where bullish traders have been actively accumulating over the past two days. Its resilience is a testament to its significance in shaping future price movements.
💎 It's crucial to emphasize the pivotal role of the current demand zone. If this zone continues to be staunchly defended by the bulls, we could very well witness a surge in the price by as much as 40%. Such a move would be a significant leap, underscoring the zone's importance in dictating the trajectory of #ASTRUSDT.

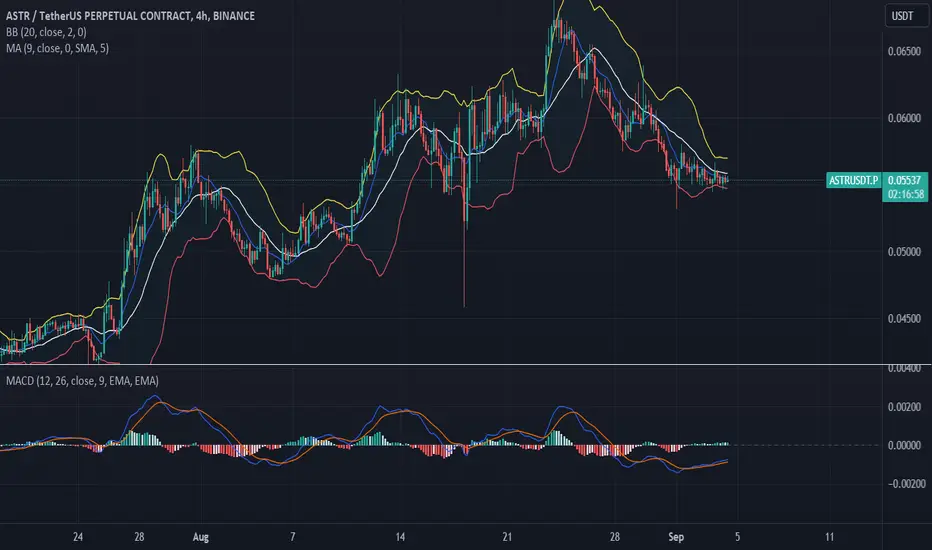
ASTRUSDTASTRUSDT was trading descending channel and recently bulls took the charge and has given the breakout from descending channel. Currently the price is retracing and creating the support around 0.060 region.
Will the bulls take charge again continue for leg higher ?

ASTR to the star! (New Impulse wave)ASTR completed wave (2), ready to go impulsively in wave (3)
Fundamentally, ASTR is a new strong L1 Blochian on DOT with good TVL

ASTR/USDT correction mode ASTR showing weakness in local top ,expecting to drop 10-15% for coming days . tested fib 0.382 level but didn't hold waiting to more correction then continue upward

📈 ASRTUSDT H4 Analysis 🚀📈 ASRTUSDT H4 Analysis 🚀
🔥 Bullish Momentum Alert! 🔥
🔍 Technical Analysis: After a thorough evaluation, it's evident that ASRTUSDT is making a strong bullish move on the H4 timeframe. The recent breakout above a significant resistance level suggests a potential uptrend in the making.
🎯 Confirmation Entry Strategy: The entry decision is supported by the Smart Money concept, indicating a strong presence of informed traders pushing the price higher. A decisive close above the resistance has been observed, enhancing the probability of a sustained bullish trend.
⚡ Why This Matters: Smart Money players, often the institutional investors and market experts, appear to be positioning themselves for an upward movement. This alignment of forces boosts the reliability of the bullish outlook.
📊 Key Points:
✅ H4 Close Above Resistance
✅ Smart Money Confirmation
✅ Potential Uptrend Ahead
🤖 Trading Tip: Consider a strategic entry with a focus on proper risk management. Remember, past performance isn't indicative of future results. Always be vigilant and adapt your strategy as the market evolves.
📈 Trade Safely! 🛡️
Disclaimer: This is not financial advice. Conduct your research and consider seeking advice from professionals before making any trading decisions.
🚀📊📈🤑🔥📉🚀

ASTRUSDT on way to daily support after hitting weekly resistanceThe price was rejected from weekly resistance which caused the price to move down and yesterday's across the market drop brought this one quickly to the next strong daily support. This daily support is very strong one as its the accumulation zone before this move up to the weekly resistance zone. Therefore we see a spectacular result of the price hitting this support and the price bounced vehemently to the weekly resistance again in no time. However, the price again got rejected from that weekly support and it is now trending downward again. I think a long trade is not favorable here. The probability kind of favoring short trades on this one at the moment at. On smaller time frames definitely some long opportunities can be exploited. I think it is likely that the price will visit usual daily support area. A bounce can be expected from there and a long trade is favored from there.

Astr Buy TradeHere is My Study on Astr.
Welcome to my channel! Here you'll find daily technical analysis ofthe latest trends in the crypto market. From Bitcoin to altcoins, I'lIl be sharing my insights and predictions to help you make informed decisions
about your investments. Follow me for the latest updates and join the conversation in the comments!
Crypto technical analysis uses past price history to predict future price. It's not a guarantee and shouldn't be relied on solely for investment decisions. Consider other factors such as market trends, economic strength and
information dissemination. Use with caution.
This Is Not A Finacial Advise

long astruHow to Trade Using the SMC Trading Strategy:
We would learn Smart money entry patterns and methods such as:
SMC Reversal Entries
How to identify valid CHOCH.
Major and Minor change of character (CHOCH)
Aggressive Entry setup
Entry Methods:
Firstly let us examine the entry method we can use in the SMC trading strategy. Smc entry methods are divided into two major subcategories namely:
The reversal entry method
The continuation entry method
The reversal entry method can further be divided into two namely:
Change of character (CHOCH) or change of market structure.
Flip entry setup.

ASTRUSDT LONG Opportunity Aug 10Structure Breakout
Red -> Green
Context: Green
ASTR, ASTRUSD, ASTRUSDT, ASTRUSDT.P, CRYPTO, CRYPTOCURRENCY
DISCLAIMER
This is just for educational purpose, it is Not financial advice, use it at your own risk.

$ASTR, first 2D buy, is it worth it?NASDAQ:ASTR
First 2D Buy on the #ASTR perp pair by the UCTS indicator
Take it or leave it 🙂

ASTR RetracementAster retracing back to .48 or .42 from its pump.
collect profits and wait for pump.

$ASTR Spring / Retest accumulationMore higher lows for ASTR here. Maintaining that lower trend, and now consolidating above the range lows on low volume.
Real easy to define risk here, and could very well be a macro bottoming structure, but even a common retracement would make this an equitable trade setup.

ASTRUSDTASTRUSDT is trading in long term bearish trend. Currently the price is retracing a bit but just about to face a long term daily declining trendline. Will these confluences push the price to lower side again?

ASTRUSDTASTRUSDT break through the long term resistance with strong bullish move.
Will ASTRUSDT sustain the momentum?

ASTRUSDTHow do you do Crypto lovers,
*Mars Signals Team wishes you high profits*
This is a one-day-time frame analysis for ASTRUSDT
In the present chart, R2 is the resistance area to mention and it expresses the unsuccessful attempts of price in order to rise. R1 used to be a support area. And finally at the bottom, S1 is a long-term support area in which the support of price at various points is clearly seen. We can observe that the price was in a rising trend after being supported at S1 each time and due to its rejection at higher amounts, it faced several declines downward. By its last rejection at R1 and before giving us a negative Marubozu Candle, we observe a tweezer pattern. Thus, the price is fluctuating above S1 area and we believe the price to have more support and fixation when it touches the mentioned area and then an increase would happen for it to reach higher amounts including R1 and R2. These are great points to save your profits but the point is to wait for the retesting process and then enter trading and wait for the time to save your profits at them. By the time we have the fluctuation of price over S1, we won’t have so much decline predicted. Bear in mind that by the time the price loses the support at S1 and moves below this area, it faces more decline certainly toward S2. Our suggestion is less decline when the price is moving and fluctuating over S1 line. Please be cautious about various points and details and remember that for enjoying less risky trades. You can obtain every piece of information and details through our analyses and updates. So keep moving with us.
Warning: This is just a suggestion and we do not guarantee profits. We advise you to analyze the chart before opening any positions.
Wish you the best

ASTR SHORTafter a good sell, we came in to test breaker and flag limit so I will be looking for shorts. basically flipped area

ASTRFriends, according to the harmonic pattern and bullish cross, I identified the targets in the four-hour timeframe.
Good luck
Karim Heydari


ASTR - Long TradeHigh risk (half position or less)
Limit Entry at 0.06259
SL 0.06196
TP1 0.06323
TP2 0.06406
TP3 0.06488

$ASTRNews: 6 April 2023 Wasm Revolution
1D:
* MA50 > MA100 > MA200
* MACD > 0
4HR:
* MACD Bullish Cross
* DI+/DI- Bullish Cross
1HR:
* MA7 > MA25 > MA99
* MA50 > MA100 > MA200
* Supertrend is long
* Price > MA50
* Chikou Span > Price
* SSB acting as support

ASTRUSDTHello Crypto Lovers,
Mars Signals team wishes you high profits.
This is a 4-hour-time frame analysis for ASTRUSDT
R1 is the resistance area in this chart with its presentation of the disability of the price to rise at several points. S1 used to be a resistance area. And S2 is a support line at the bottom with its support of price at different points. Presently, the price has a fluctuation over S1 by the time it broke this area upward in a rising trend. Due to the high density of price, we will wait for two options. Either a rise or a fall. Subsequently, we must wait for some confirmation candles to rise and an increase would be there for the price to reach R1 (which is a good point for saving your profits) besides having more fixation over S1, more rise is expected. Also by giving us some falling signs and not being supported at its current point, more decline will definitely be waiting for the price toward lower amounts. Note that for enjoying less risky trades, we recommend you to obtain every piece of information and details through our analyses and updates.
Warning: This is just a suggestion and we do not guarantee profits. We advise you to analyze the chart before opening any positions.
Wish you luck
