ACDC ETF @ CRISPY POTATOAPRIL PROBABILITY = BEAR
Last month produced a large pin bar. The volume of this pin was higher than previous Bear month candles. This pin bar can `be a sign of lower prices because of how far it went down. Conversely, it could be a complete rejection. Given the steepness of the previous rise, I se
Key stats
About GBLX ACDC ETF UNITS
Home page
Inception date
Aug 30, 2018
Replication method
Physical
Dividend treatment
Distributes
ISIN
AU0000022386
Global X Battery Tech & Lithium ETF engages in the provision to investors the access to companies involve in battery technology and lithium mining. It also aims to provide investors a return that before fees and expenses tracks the performance of the Solactive Battery Value-Chain Index by holding all of the shares that make up the index closely in proportion to the index weights. The company is headquartered in Sysney, Australia.
Related funds
Classification
What's in the fund
Exposure type
Producer Manufacturing
Non-Energy Minerals
Consumer Durables
Stock breakdown by region
Top 10 holdings
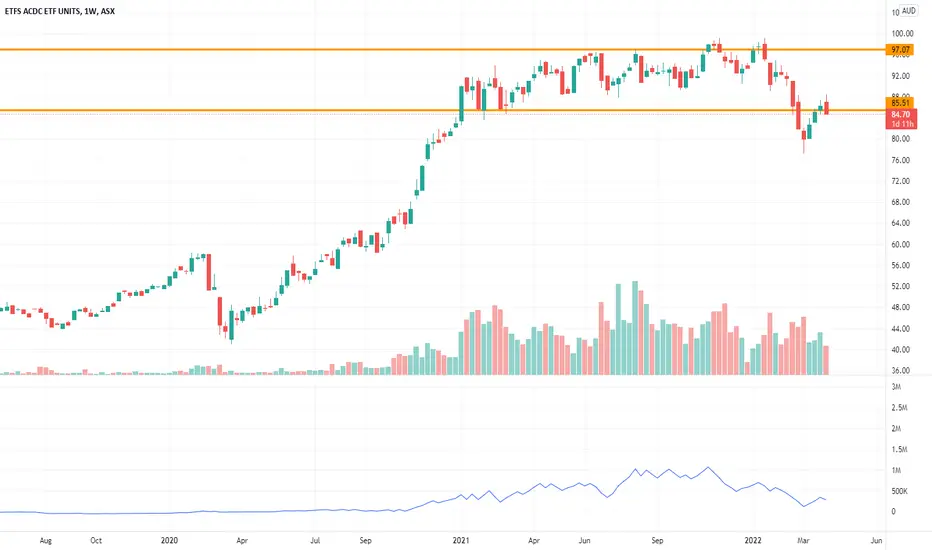
ACDC battery tech consolidation One of my favorite ETF's to trade on the ASX is the ACDC battery tech beast.
Its had a steady rise since the covid drop with over a 120% return so far, but we moved into a consolidation range with an upwards pressure since the start of the year.
We have had a few touches on either extremes of this

See all ideas
Summarizing what the indicators are suggesting.
Oscillators
Neutral
SellBuy
Strong sellStrong buy
Strong sellSellNeutralBuyStrong buy
Oscillators
Neutral
SellBuy
Strong sellStrong buy
Strong sellSellNeutralBuyStrong buy
Summary
Neutral
SellBuy
Strong sellStrong buy
Strong sellSellNeutralBuyStrong buy
Summary
Neutral
SellBuy
Strong sellStrong buy
Strong sellSellNeutralBuyStrong buy
Summary
Neutral
SellBuy
Strong sellStrong buy
Strong sellSellNeutralBuyStrong buy
Moving Averages
Neutral
SellBuy
Strong sellStrong buy
Strong sellSellNeutralBuyStrong buy
Moving Averages
Neutral
SellBuy
Strong sellStrong buy
Strong sellSellNeutralBuyStrong buy
Displays a symbol's price movements over previous years to identify recurring trends.
Frequently Asked Questions
An exchange-traded fund (ETF) is a collection of assets (stocks, bonds, commodities, etc.) that track an underlying index and can be bought on an exchange like individual stocks.
ACDC trades at 97.51 AUD today, its price has risen 0.75% in the past 24 hours. Track more dynamics on ACDC price chart.
ACDC net asset value is 97.67 today — it's risen 9.82% over the past month. NAV represents the total value of the fund's assets less liabilities and serves as a gauge of the fund's performance.
ACDC assets under management is 490.80 M AUD. AUM is an important metric as it reflects the fund's size and can serve as a gauge of how successful the fund is in attracting investors, which, in its turn, can influence decision-making.
ACDC price has risen by 11.26% over the last month, and its yearly performance shows a 16.08% increase. See more dynamics on ACDC price chart.
NAV returns, another gauge of an ETF dynamics, have risen by 9.82% over the last month, showed a 20.34% increase in three-month performance and has increased by 21.05% in a year.
NAV returns, another gauge of an ETF dynamics, have risen by 9.82% over the last month, showed a 20.34% increase in three-month performance and has increased by 21.05% in a year.
ACDC fund flows account for −112.36 M AUD (1 year). Many traders use this metric to get insight into investors' sentiment and evaluate whether it's time to buy or sell the fund.
Since ETFs work like an individual stock, they can be bought and sold on exchanges (e.g. NASDAQ, NYSE, EURONEXT). As it happens with stocks, you need to select a brokerage to access trading. Explore our list of available brokers to find the one to help execute your strategies. Don't forget to do your research before getting to trading. Explore ETFs metrics in our ETF screener to find a reliable opportunity.
ACDC invests in stocks. See more details in our Analysis section.
ACDC expense ratio is 0.69%. It's an important metric for helping traders understand the fund's operating costs relative to assets and how expensive it would be to hold the fund.
No, ACDC isn't leveraged, meaning it doesn't use borrowings or financial derivatives to magnify the performance of the underlying assets or index it follows.
In some ways, ETFs are safe investments, but in a broader sense, they're not safer than any other asset, so it's crucial to analyze a fund before investing. But if your research gives a vague answer, you can always refer to technical analysis.
Today, ACDC technical analysis shows the buy rating and its 1-week rating is buy. Since market conditions are prone to changes, it's worth looking a bit further into the future — according to the 1-month rating ACDC shows the strong buy signal. See more of ACDC technicals for a more comprehensive analysis.
Today, ACDC technical analysis shows the buy rating and its 1-week rating is buy. Since market conditions are prone to changes, it's worth looking a bit further into the future — according to the 1-month rating ACDC shows the strong buy signal. See more of ACDC technicals for a more comprehensive analysis.
Yes, ACDC pays dividends to its holders with the dividend yield of 0.13%.
ACDC trades at a premium (0.91%).
Premium/discount to NAV expresses the difference between the ETF’s price and its NAV value. A positive percentage indicates a premium, meaning the ETF trades at a higher price than the calculated NAV. Conversely, a negative percentage indicates a discount, suggesting the ETF trades at a lower price than NAV.
Premium/discount to NAV expresses the difference between the ETF’s price and its NAV value. A positive percentage indicates a premium, meaning the ETF trades at a higher price than the calculated NAV. Conversely, a negative percentage indicates a discount, suggesting the ETF trades at a lower price than NAV.
ACDC shares are issued by Mirae Asset Global Investments Co., Ltd.
ACDC follows the Solactive Battery Value-Chain Index. ETFs usually track some benchmark seeking to replicate its performance and guide asset selection and objectives.
The fund started trading on Aug 30, 2018.
The fund's management style is passive, meaning it's aiming to replicate the performance of the underlying index by holding assets in the same proportions as the index. The goal is to match the index's returns.