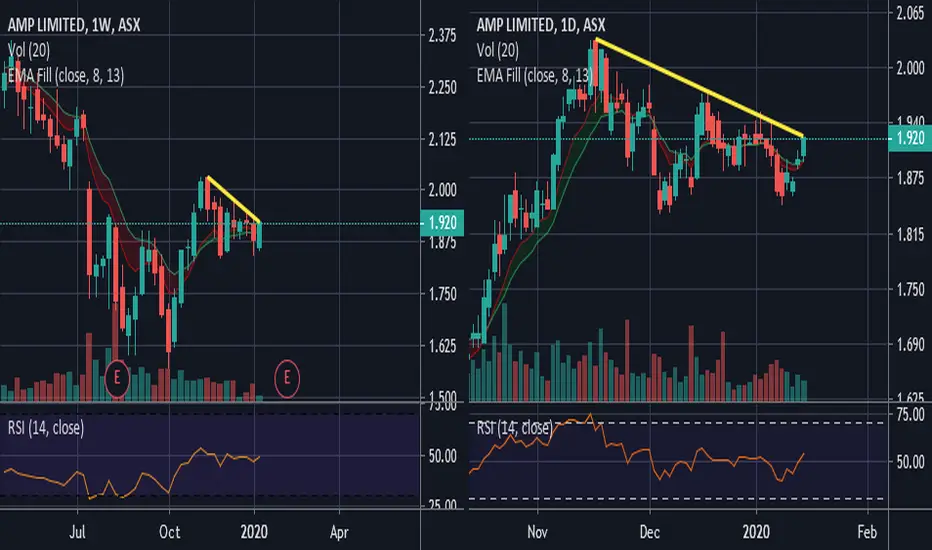
AMP(ASX) Monthly ChartDoubling up on my prior post,
The quarterly and the monthly chart both have the same 2618 pattern present
If today closes where it is we will have the same bullish pattern on 2x timeframes both with bullish hammer patterns present
AMP trade ideas

AMP (ASX) Quarterly 2618 patternAMP (ASX) on the quarterly has a 2618 pattern
This is a double bottom followed by a breakout in this case its to the upside confirming the double bottom, followed by a 61.8% retracement
Hence named 2618
If today closes near where it is, it will form a bullish hammer which supports a move higher in the medium term
Full disclosure I already own this stock from last year and posted about it a few times already

AMP - Set for a comeback?After a troublesome decade, is AMP Limited set for a recovery?
Our Bullfinder-official Team has identified a potential opportunity within ASX:AMP
If price can hold above the $1.220 mark, there may be potential for a re-rating of momentum to 'bullish'.
We would like to note however that below ~$1.220 significant bearish continuation risk comes into play.
We're inspired to bring you the latest developments across worldwide markets, helping you look in the right place, at the right time.
Thank you for reading! Stay tuned for further updates, and we look forward to being of service along your trading & investing journey...
Disclaimer: Please note all information contained within this post and all other Bullfinder-official Tradingview content is strictly for informational purposes only and is not intended to be investment advice. Please DYOR & Consult your licensed financial advisors before acting on any information contained within this post, or any other Bullfinder-official TV content.


AMP $1.12 POTENTIAL terminal shakeout (TSO)With almost a billion $ in cash yet to be returned to SH's (which includes a $370M share buy back)
& dividends being restored (Ex 01/03 2.5c ehh,its a start)
& the weekly structure,
if this doesnt shred stale holders soon i will be VERY surprised
Holding, initial target in red, then freehold the rest

AMP.ASX_Bullish Breakout Trade_LongENTRY: 1.395
SL: 1.330
TP: 1.530
- ADX>25
- Daily RS +ve
- Daily FFI +ve
- Weekly RS +ve
- Weekly FFI +ve
- Moving averages are aligned.
- Entry today based on today breakout and >3% rebound off 10EMA with volume.

AMP Weekly ChartA long term position in my portfolio
Has a decending wedge that has broken out and retested, as well as a 'Cup' which could form part of a cup and handle pattern...
Whatever the pattern is called, it appears to be basing out and has consolidated so the path of least resistance is higher in my opinion
Breakout this week... so likely to climb significantly as the base is now there...


AMP signal detectedASX:AMP
AMP made a strong up move in June but like Amazon's willy, is back down to Earth

AMP Daily chartAMP daily chart
Looking for support around $0.96 - $1.06, hoping it drops quickly and forms a base

AMP WeeklyLooking for buying pattern to emerge on AMP around 1.06 - 0.96
Has long term harmonics, major number $1.00 and if it drops quickly and forms a base it will also have divergence on RSI

Weekly Chart #ASX #ASX200 #Stocks #investing #trading Hi all,
Keep an eye on it.
Wait for consolidation and plan your entry.
Enjoy!

Long trade on AMPAMP is currently trading at all-time lows. I do anticipate price will trade sideways for some time until the company finds stability and confidence within its management, albeit not long-term.
With respect to the technicals, it is clear a double bottom has formed on the weekly time frame which has married the plummet of Covid in March 2020. I am not convinced selling pressure will continue beyond $1.05-1.06. This is a great long trade with excellent risk:reward prospects on one of Australia's most renowned dividend-paying public companies.
Thank you traders. Manage your risk.

AMP.ASX_Breakout and Retrace_ShortENTRY: 1.26
SL: 1.33
TP1: 1.18
TP2: 1.075
- ADX<25. Would like to be higher.
- RSI<40. Would like to be lower.
- RS and FFI -ve.
- MACD -ve.
- MAs aligned.
- Breakout with good volume on 29 Mar 2021 and retraced the next day but got rejected on 6 Apr 2021.

AMP Limited - LONG (BUY)AMP Capital Global Shares Index Fund is my latest stock market investment which I just thought to share with you all.
Forex trading creates a monthly payout to keep food on the table and stock market investments is used to let the capital grow. Excess profits from FX goes into stock market investments for a medium to long term investment. Don't work for money, let money work for you ...
With the AMP Capital Global Shares Index Fund you can invest in over 2000 companies around the world. This fund includes companies across a broad range of sizes and sectors in developing and emerging markets—including well-known companies like Facebook, Johnson & Johnson, Samsung, Coca-Cola, Visa, Apple and Boeing. And excludes tobacco companies and controversial weapons such as nuclear weapons, cluster bombs and landmines. As a passively-managed fund the AMP Capital's All Country Global Shares Index Fund, aims to replicate the performance of the MSCI All Country World ex Tobacco Index as closely as possible providing a simple, low-cost solution for investors. A proportion of the fund is ‘hedged’ to help protect from any wild fluctuations in the Kiwi dollar.
I am not a financial advisor, accountant or lawyer. Any information provided on this analysis is not intended as investment or financial advice. It is merely information based upon my own experiences. The information I present is of a general nature and should merely be used as a place to start your own research and you definitely should conduct your own due diligence. You should seek professional investment or financial advice before making any decisions.

AMP M formationsM formation
Neutral formation in a bearish trend
Seems to be forming an inverse H&S similar to one previously seen
High risk high reward
I believe this will play out bearishly however. Continuation of the bigger M formation (in orange)
Quite hard to decipher the nature of this chart,

Inverted Head & Shoulder pattern. Wait for a retest An inverted H&S pattern with a break. My simple advice is let the price action retest the break & move up before you commit


AMP- long potential squeeze those shorters back to gap close Prices building chart structure and internal price behavior says buying internally atm but will it hold , finding chart from d1 looking clearest, could fine tune entry on lower times frames if price action confirms big boys are keen next week , markets are in oversold conditions - caution as its potential CT trade meaning we need extra PA and confluence then confirmation for this move upwards. neutral while bullish PA builds more PA the better.

Falling wedge for AMPStoch and RSI looking good for breakout, volume increasing .
Just my take not investment advice, I will watch this one.

PHASE D ACCUMULATION? - ASX:AMP - AMP LIMITEDAMP has seen a dramatic fall in the share price over the last 12 months. This time last year it was at $5.40. In late October we saw large volume, climatic action and ultimately stopping action at $2.28. The stock rallied to $2.77 which formed the parameters of our trend channel. Notice when the stock tested the $2.28 level in November and December, there was very little volume. It appears a lot of the supply was taken out of the market with the climatic action previously. This was a transfer of the stock from weak hands to strong hands.
Throughout February we fell down lower than the bottom of the trend channel and formed two springs - notice the volume increased. Think of the psychology at this level, if there were any weak hands holding on at this level, the push lower and the fear of further falls would have had them closing their positions. The stock tried to rally at this point but the volume wasn't overly great, showing that there would be some retesting. On the 27th February the stock pushed down lower on very little volume, indicating supply was drying up.
We are now at an interesting place on the chart, do we start Phase D of Wyckoff accumulation and start to move higher, if this is the rally that sees a sign of strength and the top of the trend channel taken out, we need to see nice change in character and demand come into the stock ie. nice wide range up bars on good volume.
Monitoring this one closely...
