ASX trade ideas

ASXThe ASX has hit the bearish market hard in march 2020. It was able to recover in a matter of months. Most markets take a long time to recover. The ASX was able to hit the resistance line.


Barley and Sun Tzu Art of WarRead latest news here
Sun Tzu Art of War :
You can be sure of succeeding in your attacks if you only attack places which are undefended. #
Typically, at least half of Australia's barely exports would be bound for China............
The tariffs, based on dumping and farm subsidy claims, would end Australia's $1.5 billion barley trade to China......
Barley is Australia's second most valuable agriculture export to China.......
In War, it is never clear and the art of staying ambiguous is what China , 5000 years of history has provided them with. It is a known fact that transparency is not THE word to use in China where media is controlled and anyone found posting negative comments about it are dealt with , sometimes in mysterious ways.
The chart tells us the constipated feeling the ASX index is feeling right now, unable to break above the resistance after so many attempts.
The price can stays within the rising channel for a while before it breaks down and this barley incident may or may not be the catalyst.

ASX | Hourly correction for more upsidehey traders,
asx looks to be beginning hourly c wave down before trend continuation to the upside

ASX Idea :)Idea for ASX
Multiple ascending scallops
using fibonacci spiral for a support which is also a .236 retracement from the top formed
I've made a few ASX ideas lately but i'm Australian so i feel it suits.
This is a very long term chart!

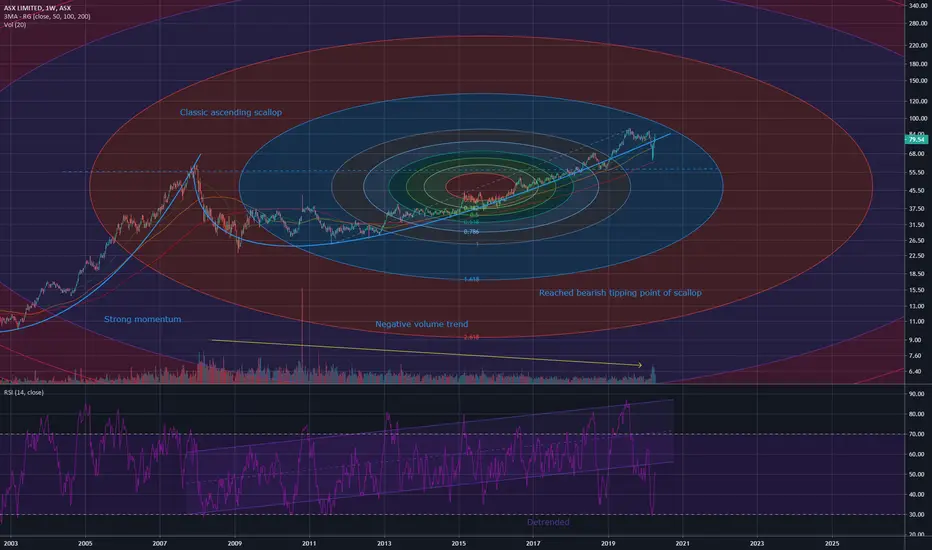
ASX Fib Circle and Ascending ScallopShowing the potential bearishness is an ascending scallop
The leg of the scallop has been extended so far that momentum has decreased and bearish momentum has been engaged
I am very bearish on Australian stocks.
First time using fib circles :)
ASX 200 1st April BOOOM Look at this monthly wick it’s dying to bounce up 1st of April is the new wick all the stimulus etc,etc,
#ASX200
#BTC
buckle up this market has a bounce incoming
Manipulated global panic cause the largest and most devastating destruction around the world and this market gonna go boom somehow 🧐
I’m somewhat dissapointed and a little saddened by the fact this literally all seems to be China controlling the world on a global economy and potentially doing it for BTC HALVING 🧐 just a theory far fetched but hey this year has been messed up enough, ❤️

Expected outcome Longterm for the ASXWe are in a much worse situation than the GFC. I think we have a way to go yet and will see this thing playing out for months to come as businesses default, housing crashes etc. The Bottom is way off. Just ride the way and play the ups and downs.

ASX | more upside hey traders,
no divergence present. trend-line still valid. alot of people are freaking out (aus television) could just be a running flat... still not a fan of the daily macD growth. lets see how it plays out
regards,
TM

ASX bull trapLikely close below the 200MA on the weekly chart will lead to further downsides as the alligator indicator opens up bearishly. Also currently sitting under the ichimoku cloud, providing a resistance. We could be on the brink (early stages) of a recession.


ASX200 HUGE MARKET REVERSAL INCOMINGHUGEEEE TRADING OPPORTUNITY
This is going to pop up for the stimulus package in Australia, I don’t particularly care about this but I am looking for an indicator for BTC and if BTC is still following traditional markets there is a huge bounce incoming
Weekly chart showing a very possible upwards direction
I’m guessing whenever Scott Morrison releases his beefed up stimulus this market will go straight back up to where it was
I think this is like the original BTC bubble from 2017 it’s just the start all the markets are going to make for amazing trading
2020
Not advice do not use this in anyway as investment idea

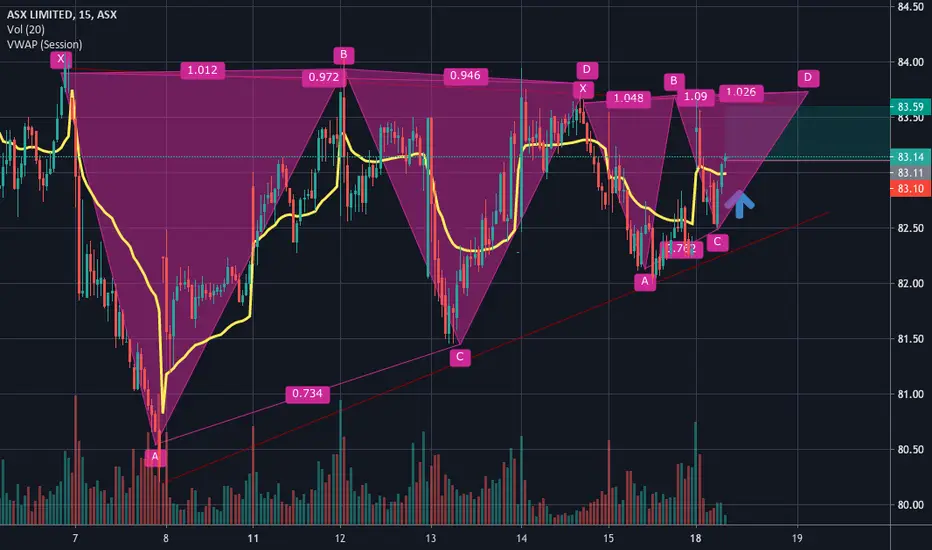
ASXASX looking very dangerous here
AB=CD objective hit
Price has reached the 1.618
Price has moved higher but volume is dropping off
Indicators sowing its overbought
With an impending GFC upon us, it would surprise me if we see a drop to the 618.

ASX IdeaPotential short opportunity, can be seen to be hanging under the resistance line, with an immediate death cross on the daily chart in play, these are usually more effective on the weekly chart but we will see how it plays out. Aussies spending too much money on toilet paper..

ASX needs helpThe market has slipped nearly 13% from its peak in Aug 19. Chart shows several times that the price action has displayed fake breakouts.Now, we see a pin bar outside the bearish trend line. It is likely to fall back into the bearish trend line next week and may even goes further south to the direction indicated.
Alternatively, it could gain some support at 79.15 level and rebound and continue to bring cheers to the buyers. We will be monitoring the price action first.


Selling ASXNotice after the gaps been closed, the price action kept hovering around this price level,
making it a strong support level.
Last 2 red candles are highly bearish, pin bars and likely to falls back to the support level again.
SELL

Short #ASX at current market price for target 75.1Stop Loss: 82.35
Target: 75.1
Short at current price for the e2e on Ichimoku
The indicator has signalled sell at ease.


ASX: Australian stocks approaching a peak.The ASX Ltd is on a very strong bullish monthly streak having gained over +25% in 2019 alone. It appears to be trading inside a 20 year Channel Up that displays all phases of a Bubble (aggressive rise, blow-off, consolidation) from Higher Low to Higher.
Currently it is near the end of the bullish leg towards a new Higher High (peak) which is projected within 80.00 - 84.00 towards the end of 2019 (based on a 1702 day Bubble Duration). All charts are overbought (or close to) from 1D (RSI = 72.582) to 1W and 1M (RSI = 76.630 and 73.368 respectively) indicating that the peak of the bubble is indeed near and should be achieved on this final 2019 push.
Our strategy is to buy on every dip until this Target Zone. Then depending on circumstance and mostly global trade dynamics, we will most likely start building up a short base but updates will follow.
** If you like our free content follow our profile (www.tradingview.com) to get more daily ideas. **
Comments and likes are greatly appreciated.

ASX 200 Best Performing Stock Market in the WorldAustralia hasn't suffered from a recession in more than two decades. Its stock market highlights this fact as it has risen 1400 percent since 1999, a feat which no other major equity market in the world is even close to accomplishing.
