ASX , strong recovery with high short interest = BuyNot much more to say .
tough entry buying a breakout , safest would be to wait for the breakout higher and buy first pullback/retest of the breakout levels around 69ish.
ASX trade ideas
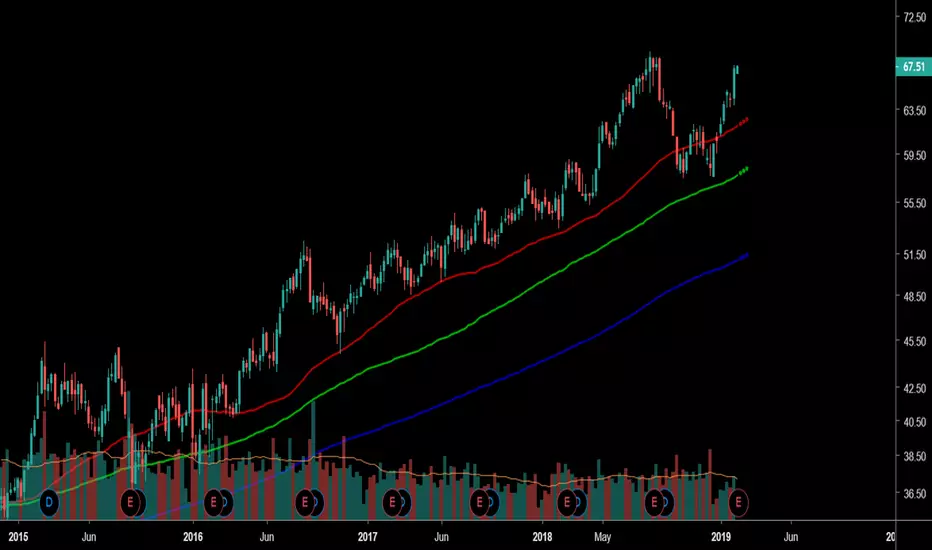

ASX Top HeavyLooking at the ASX on the monthly chart
Seems like a never ending 10 year bull market
*Years calculated since last retrace in 2008 to current 2019 is 11 years. We are coming to the end of another 10 year market cycle (or GFC)
*I've added an AB=CD (in blue) to price to project where D will end. I've also cloned price for a better visual.
*Target objective is showing to hit the 1.445 fib extension
*I've cloned the 2008 GFC pull back and added it to the top of price for a projection of where price may pull back to.
*The fibs from A to B retracement hit the 618 fib and with the clone setup from C to D also fit the 618 retracement which also happens to ling up perfectly with the trend line.
*Volume has dropped off significantly
*OBV has created a W indicating price wants to go higher
*Bearish divergence in the Histogram
*Will is embedded and stupidly over bought
*RSI is also showing bearish divergence
*VPVR is also showing that its in single ticks
*The 200ma is also sitting around the POC of VPVR at $35
*With a GFC inevitably lurking around its only a matter of time before this bull comes to an end.
* Don't forget to hit that like button and follow me on Trading View for more chart analysis :)

ASX Double Top. The end to the bull run!!!SMP TRADING
SELF DEVELOPMENT/METHODOLOGY/PSYCHOLOGY
Chart time frame - H4
Timeframe - 1-2 Weeks
Actions on -
A – Activating Event
Market will meet resistance in zone @68.90 - ..... and fall to @ 58.00. In order to enter, the pair MUST be in line with my Entry Procedure....
B – Beliefs
Market move towards the first Target 1 level @ 58.00
ASX:ASX
Trade Management
Entered @ Sign up for mentoring
Stop Loss @ Sign up for mentoring
Target 1 @ 58.00
Target 2 @ ....
Risk/Reward @7.1
Happy trading :)
Follow your Trading plan, remain disciplined and keep learning !!
Join our Mentoring Program TODAY!! twitter.com
Please Follow, Like,Comment & Follow
This information is not a recommendation to buy or sell. It is to be used for educational purposes only!

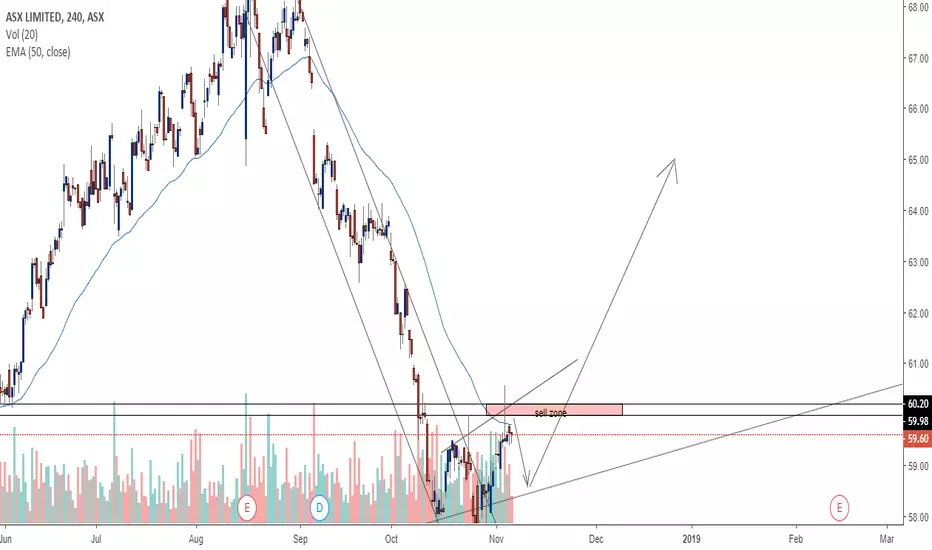
ASX (AUS200) (AUS200Cash) LONGThe Australian Stock Market index is looking very bullish, due to the double top pattern forming on the lower timeframes. The higher timeframes also signify a rally, which sets the mood for this trading signal. I would wait to see how rice would react to the 61.50 level, which represents an institutional level, and was also tested previously Then an entry would be made after this retest. Do note that the price may not retest that far as it all depends on the buying pressure. The 200 EMA is currently moving below the price in the lower timeframes, which also prepares us for buy positions. I would expect the price to rally further with the target being the height of the "W" pattern.

ASX sells ASX posted the drop a while ago but heres a follow up. c wave down to complete the structure before continuing upwards

ASX Index Massive Bear Move coming!!SELF DEVELOPMENT/METHODOLOGY/PSYCHOLOGY
Chart time frame - M
Timeframe - 6-12 Months
Actions on -
A – Activating Event
Currency Pair creating a higher second top . Currency pair will move south from current levels to the @40 level
B – Beliefs
Market will be rejected at @current levels and move towards the first Target 1 level @ 40 level.
ASX:ASX
Happy trading.
Follow your Trading plan, remain disciplined and keep learning !!
Please Follow, Like,Comment & Follow
Thank you for your support :)
This information is not a recommendation to buy or sell. It is to be used for educational purposes only!

ASX We could see a potential sell trade close to the resistance, which has been tested in the past from both sides. After that, price may continue in it's rally by bouncing of the ascending trendline, and going further up as shown. The price has already broken descending channel and therefore we just wait for a retest and then buy the market


ASX DROP!hey guys,
I'm forecasting ASX to drop and complete the c wave part of the structure before going back up. This drop will be very impulsive (as c waves are generally impulsive in nature) it coming near the low before going back up.
Regards,


