Centaurus Metals ready to rip?After declining by more than 80%, Centaurus Metals has broken out of its downtrend. While this may be the first step in a multiweek base-building process for the nickel mine developer, the chance of a v-shaped bottom makes Centaurus worthy of a speculative add following this seriously bullish price action.
CTM trade ideas

CTM challenge to break 1,25I am predicting a breakout by the dates shown on the chart. The trend in rising RSI and MACD is convincing.

CTM sideways resolution coming when?Here I have resolved a possible 'ultimate decision' for CTM based on a confluence of the point at which:
1. MACD finally pushes completely through the zero line.
2. The RSI base builds to 40ish
3. The 50-day (orange) and 200 day (purple) converge for the golden cross.
4. The revised lower channel (yellow dashed) coincides with the MA's.
My target for the decision is 28/02/2023. It may happen prior, or not at all. All speculation of course.

CTM napkin math predictionUsing Blue vertical bars from the time where MACD breaks up past 0,00 and dotted blue lines where the SP peaks. Seems to be a pattern 410 days between solid blue with peaks at 300 days and a drop over 110 days.

CTM @ 15 OCT 2021Text me if you have any questions/comments for me.
-----
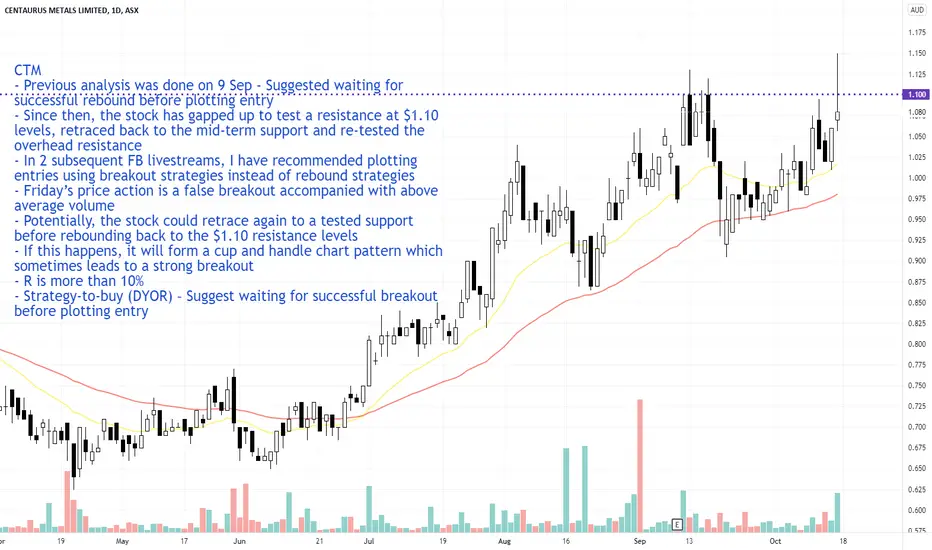
CTM
- Previous analysis was done on 9 Sep - Suggested waiting for successful rebound before plotting entry
- Since then, the stock has gapped up to test a resistance at $1.10 levels, retraced back to the mid-term support and re-tested the overhead resistance
- In 2 subsequent FB livestreams, I have recommended plotting entries using breakout strategies instead of rebound strategies
- Friday’s price action is a false breakout accompanied with above average volume
- Potentially, the stock could retrace again to a tested support before rebounding back to the $1.10 resistance levels
- If this happens, it will form a cup and handle chart pattern which sometimes leads to a strong breakout
- R is more than 10%
- Strategy-to-buy (DYOR) – Suggest waiting for successful breakout before plotting entry

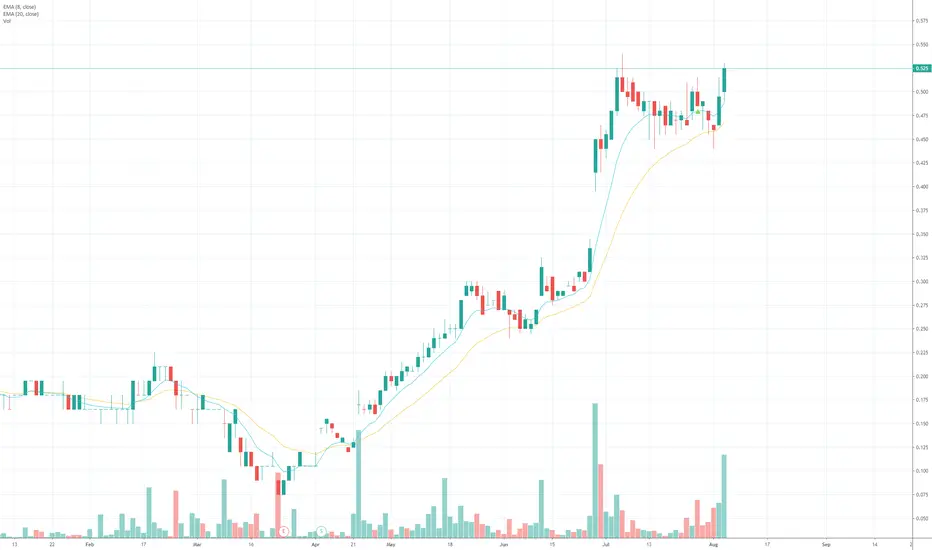
$CTM 61.5 the break.theyve got Nickel. see if they have buyers to push it through 61.5 and test old highs this week.
Nice open on the spruik news. Like an afternoon run vs a morning glory pop. Old cliche that Pros close, hopefully to the upside!
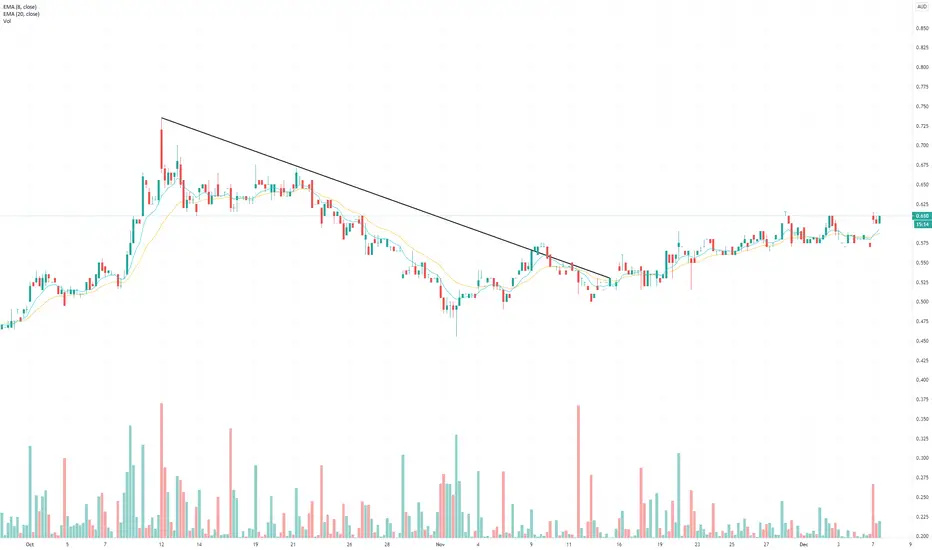
CTM Rising wedgeI think I have identified a rising wedge here. This is usually a bearish signal after an uptrend. Looking to see if it breaks down through the wedge.
The MACD is still below zero and so it is possible it might hit that and drop from there. I'll be looking to see if the RSI signals over-bought on the next high-high close.

CTM projection for 1st qtr 2021This chart uses trend lines from July 2020 after the jump occured. I am also integrating trend-based fib progression to determine where those trends intersect on the timeline.
I would like to think that scenario 1 will be the play as CTM is very bullish over long time frames.

$CTM upward sp pressure and a pop in the Ni pricewas looking for a break of 59 on Friday and got this on nice volume. Interesting week ahead. More good drill news wouldn't go astray, but they seem to trickle that out unfortunately.

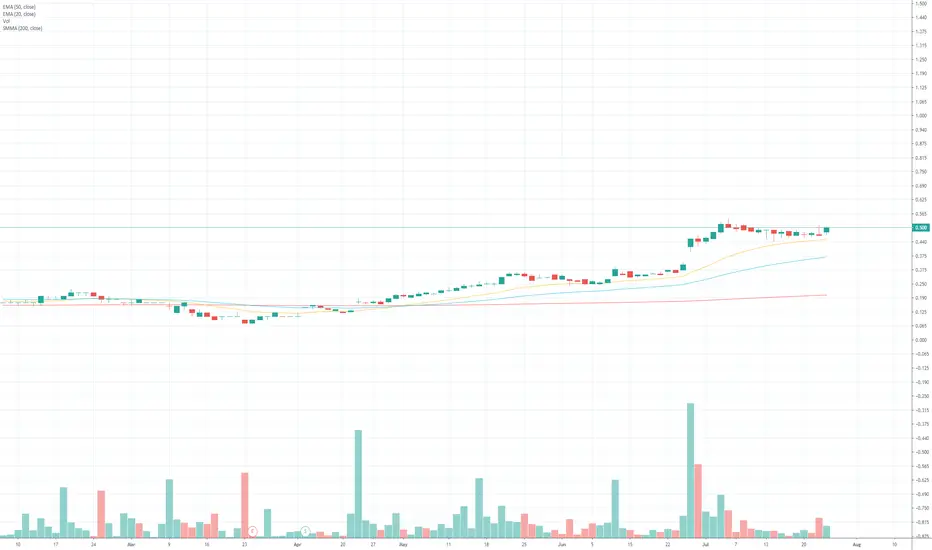
CTM in descending triangle and thoughts on a breakoutDescending triangle pattern looks like being established, although I'd like to see three verifications of the pattern rather than the two we have here.
I am considering the following three possibilities going forward...
Option 1: Breakdown within triangle to 0.465 before resuming upward trend.
Option 2: Breakdown out of triangle to 0.395 (top of 'GAP' and 200 day average) before resuming upward trend.
Option 3: Breakdown out of triangle to 0.345 (effectively filling the 'GAP') before resuming upward trend.
I have seen the GAP filling idea in operation before, but can't remember where. It will be interesting to see if that happens here.

CTM Target March 2021Using two historical trendlines (in yellow) and recent descending triangle pattern (in white) I am projecting a 0.795 target in early MArch 2021.
Although I think the yellow trendlines are a good indicator of general movement, I am not too sure about the triangle pattern. In my other published idea, I wonder whether the breakdown out of the triangle will occur. If it does, this idea may not eventuate as I am thinking.

$CTM large mispricing according to expert analyst. Break of 54Finally breaking out of the 48-54 on boss like volume. See how they close this thing.
Nickel resource play.

$CTM Nickel stock looking for an entry around that 52-54 levelKind of stock that youd be forgiven for drawing a BGA on. Recent raise and big houses buying today. Primed. Nickel futures suggest theres more in this.
$CTM just finished cap raise and they want it. 51 the break. sensational looking chart. short base here after the 42c cash raise (always makes me nervous) but in a weak tape today, they came for it. Lets see if they test the recent high of 54 and then what?
Drilling program about to commence so all the normal caveats.
ASX:CTM Words RequiredIntro Preface Monologue
Australian/global Kleptocrats continue the pillaging of resources for self serving purposes while leaving the homeland country with nought either by selling juniors to increase ponzi balance sheets of other ASX majors at a fraction of their value at shareholders expense or pay gigantic fees and 'capital raising' sale of shares into offshore accounts, effectively printing money (stock fiat) by selling/marketing dreams. I sometimes wonder what all those off balance sheet major banks derivatives are?
I like to think of it as the penny dreadful Crookislands offshore cash hoarding emergency allocated derivatives scam, hence forth know as (PDcocheads) scale, since acronyms are all the rage these days. The PDcocheads scale is out of 9, increasing non linearly similarly to Richter. Contributing factors of the PDcocheads scale include but aren't limited to, grossly over paid directors, fake news released at technical market tops to create volume to sell into FOMO, convertible notes, anti dilution clauses for major share holders, bloated upper management, unsustainable project lists (land hoarding), stock forum non-sense cheer leading, inversely flaming at technical market bottoms and others (you get my drift).
I am a well qualified highly experienced non financial engineer, not qualified to give financial advice, hence, the PDcocheads scale is of comedic nature only, also known as get a sense of humor you nob. An informal look at human nature, cronyism, the nature of all things mathematical, geometric (scared?), Fibonacci and the like. Feel free to use the PDcocheads scale in your own evaluations. I rate myself a 9/9 so don't waste your breath and make financial decision at your own risk.
CTM Specific
Chart pretty much speaks for itself. Cheer leading nonsense on forums is strong, which is always a worry. If I was a crony I'd keep that stock price hard against the red upper regression line while pumping the dream and raising more capital to sell to anyone dumb enough to buy it. Chart certainly 'looks' divergent, hence full disclosure I have a small position at 0.008.
Id rate this one roughly 4/9 with its true nature to reveal itself in due course.

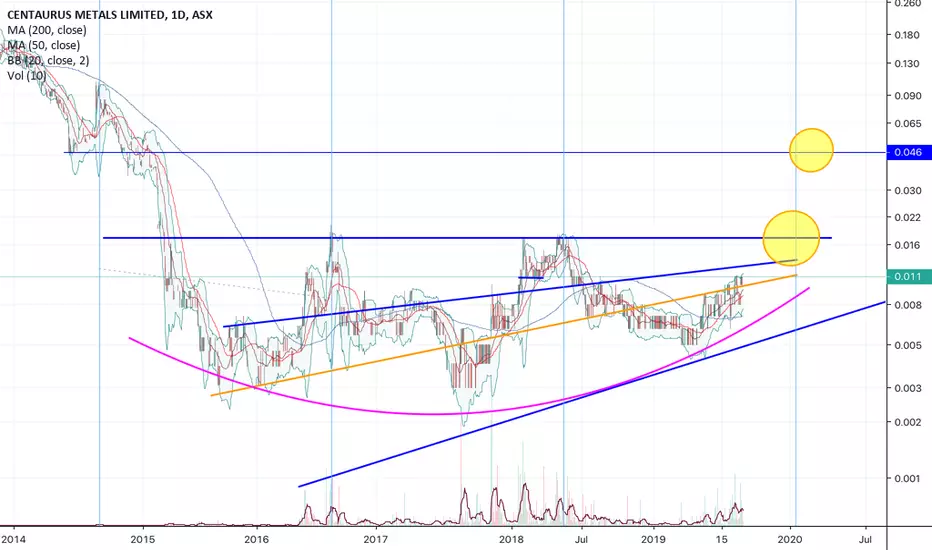
CTM.ASX cycle linesCycle lines are one of my favourite things. Not only can you get an indication of potential price, but there is also possibly the more critical factor of getting your timing right. This is a chart that I had done long ago and I found it while trawling through an old watchlist. As such, the lines on here are for a arithmetic chart, not a log chart as shown. I work off an iPad normally so you’ll be lucky to get another chart out of me. However, in order to get the cycle lines to match up sacrifices had to be made.
As you can see, since mid 2014 there has been a repeating cycle of roughly 1 and a half years duration. It appears that at the time that it has reached the bottom of this cycle that it is gearing up for another run. However, we appear to be blessed, as the coincides with a rounding bottom drawn in with pink. If the cycle continues, a primary target of 0.017 can be set. However if a breakout occurs at that point a secondary target is available to 0.046, based on a previous level of resistance.

CTM pnf update $0.017 with volumeLooks ready to actually move now
Pnf completed
See chart for target notes

CTM LongCentaurus Metals (ASX: CTM) is an ASX listed exploration company offering highly leveraged exposure to a rich asset base in Brazil including exciting new greenfields copper-gold, nickel-cobalt and iron ore exploration projects.
The Company is maintaining an aggressive exploration program across its Brazilian asset portfolio, aimed at generating new discoveries to deliver shareholder value.
Centaurus’ core focus is on its +250 sq km landholding in the Carajás Mineral Province, one of the world’s premier mining addresses. The Carajás Mineral Province hosts current resources totalling more than four billion tonnes of copper gold ore.
Centaurus Metals is pleased to announce that the first exploration activities at its newly acquired Itapitanga Nickel Cobalt Project in northern Brazil have returned high grade cobalt mineralisation of up to 0.52% cobalt (Co) in rock chips and 0.19% Co in channel samples
With exploration activities set to ramp up again significantly over the next two months, the Company has already mobilised its exploration team to the project and a broad soils and auger drilling program is underway.
First results from soil sampling and auger drilling are expected in the coming weeks.
Concurrently with the extensive work being undertaken now on the Itapitanga Project, the Company continues to plan for its maiden diamond drilling program at its flagship Salobo West CopperGold Project, which is scheduled for May/June after the end of the current wet season, and its initial RC drill program at its Pebas CopperGold Project which is planned to start after the first round of RC drilling at Itapitanga is complete.
Similar results at itapitanga project to the jacare deposit which is close by and is one of the highest cobalt grades globally
Licencing for drilling at Salobo West advanced with the relevant approvals anticipated to be available in H1, 2018 to facilitate the start of drilling following the end of the regional wet season in May 2018.
CORPORATE Cash Position At 31 December 2017, the Company held cash reserves of A$0.82 millConcurrently with the extensive work being undertaken now on the Itapitanga Project, the Company continues to plan for its maiden diamond drilling program at its flagship Salobo West CopperGold Project, which is scheduled for May/June after the end of the current wet season, and its initial RC drill program at its Pebas CopperGold Project which is planned to start after the first round of RC drilling at Itapitanga is complete.ion.
Should R3M complete the minimum work program before the end of March, they can elect to extend their option over the Project for a further six months. Should they decide to exercise the option, they will be required to pay Centaurus R$3 million (A$1.2 million) as a non refundable advance of a 12% production royalty

CTM Short Term TL break on volume, with gap aboveWeekly CTM chart has breached a Short Term Trend Line and is sitting at recent resistance 1c, over to the left a hefty gap above in sights.
The past 5 months has put in 2 solid bases and volume drop's off in each range, followed now with 2 increased volume weeks, live bar has 2 days trading until close.
New range in sights with a big gap above at 2.3 - 2.9c.
Uncertain on all the F.A so feel free to comment.

$CTM Short Term TL break on volume, with gap aboveWeekly CTM chart has breached a Short Term Trend Line and is sitting at recent resistance 1c, over to the left a hefty gap above in sights.
The past 5 months has put in 2 solid bases and volume drop's off in each range, followed now with 2 increased volume weeks, live bar has 2 days trading until close.
New range in sights with a big gap above at 2.3 - 2.9c.
Uncertain on all the F.A so feel free to comment.
