Finer Market Points: ASX Top 10 Momentum Stocks: 7 Feb 2024ASX:RDM ASX:DRO NYSE:BOC ASX:ZIP ASX:RIM OSL:NTI NYSE:HMY FWB:CXU NYSE:BIO NYSE:FND
Momentum leading shares are the market's best performers today. They are the fastest-growing shares on the ASX over the last 90 days. These companies can't get to be leaders without first appearing on our Launch Pad list.
The Launch Pad List is published weekly on Fridays.
Today's ASX's Top 10 Quarterly Momentum Stocks are:
Red Metal Limited (RDM)
Droneshield Limited (DRO)
Bougainville Copper Limited (BOC)
ZIP Co Limited. (ZIP)
Rimfire Pacific Mining Limited (RIM)
Neurotech International Limited (NTI)
Harmoney Corp Limited (HMY)
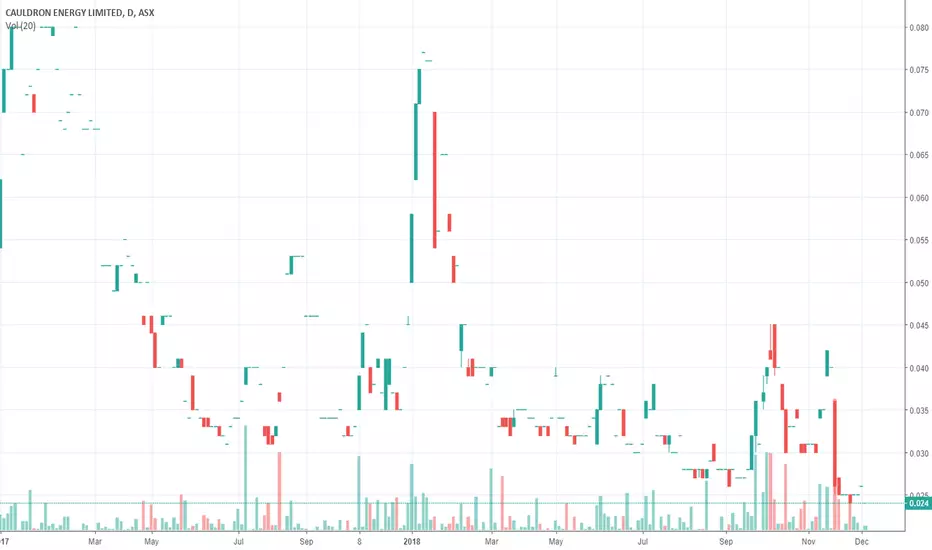
Cauldron Energy Limited (CXU)
Biome Australia Limited (BIO)
Findi Limited (FND)
CXU trade ideas

CXU ASX - SMMA MACD Buy Sell Indicator - EMA Entry Exit PriceIntroduction:
In the quest for market precision, I've developed an indicator that stands on the shoulders of traditional MACD but sees further by using SMMA for smoothing and EMA for real-time price referencing. This indicator aims to identify entry and exit points with greater accuracy and reduced lag, catering to the needs of traders who seek clarity amidst the market's inherent noise.
The Concept:
The core idea is to refine the MACD signals using the Smoothed Moving Average (SMMA) instead of the commonly used Simple Moving Average (SMA). This approach provides a less erratic and more reliable signal line. When the SMMA MACD crosses the signal line, a buy or sell signal is triggered, with the EMA (3-period) at that precise moment serving as the entry or exit price.
Why SMMA and EMA:
SMMA offers a balanced view by equally weighting the price data, thus ironing out sudden spikes and drops. The EMA, known for its responsiveness, complements this by providing a current price that aligns closely with the latest price action, making each signal relevant and timely.
Analysis and Prediction:
Entry Points (Buy Signal): When the SMMA MACD Line crosses above the Signal Line, a green label indicates a bullish signal. The associated EMA price at the time of the signal can be considered as an entry point, potentially capitalizing on upward momentum.
Exit Points (Sell Signal): Conversely, when the SMMA MACD Line crosses below the Signal Line, a red label designates a bearish signal, recommending an exit or short position. The concurrent EMA price signifies a potential exit point to capture gains or limit losses.
Trade Idea for CXU on the ASX:
Buy Signal: The 'BUY' signal was generated when the SMMA MACD line crossed above the Signal line, with the entry price set at the concurrent EMA value. In the case of CXU, this signal preceded a significant uptrend, suggesting that the indicator is effective in catching upward movements early on.
Sell Signal: The 'SELL' signal appeared as the SMMA MACD line crossed below the Signal line, indicating a potential shift in momentum. The EMA price at this point provided a precise level for traders to consider closing their positions to capture gains or limit exposure to a potential downturn — as evidenced in the CXU chart where the price showed signs of peaking shortly after.
Profit Targets and Stop Loss Considerations:
While the indicator provides a strategic entry and exit framework, traders should combine these signals with their risk management preferences. Setting a profit target at a reasonable percentage above the buy signal EMA price can lock in gains, and a stop loss slightly below can protect from unexpected downturns.
Conclusion:
The "SMMA MACD Buy Sell Indicator - EMA Entry Exit Price" demonstrates a promising approach to market timing on the CXU chart. It’s designed to smoothen out the volatility and provide clearer signals, which could be especially beneficial in the dynamic environment of the ASX. Traders are encouraged to test this indicator within their trading strategy, observing its performance and adjusting their parameters to match their individual risk tolerance and investment goals.

CXU - Breakout?CXU has fiercely broken out of its downtrend line and the price action coupled with very high volume is very constructive. Being a Uranium stock and the increasing prices of Uranium, this looks like it will continue on the upside on a tear. I am bullish CXU with a TP 1 of $0.055 (potential 25% gain) and TP2 - $0.068 (potential 50% gain).
Please note these are my own notes, by no means trading advice. Please do your own research before entering into any trade.