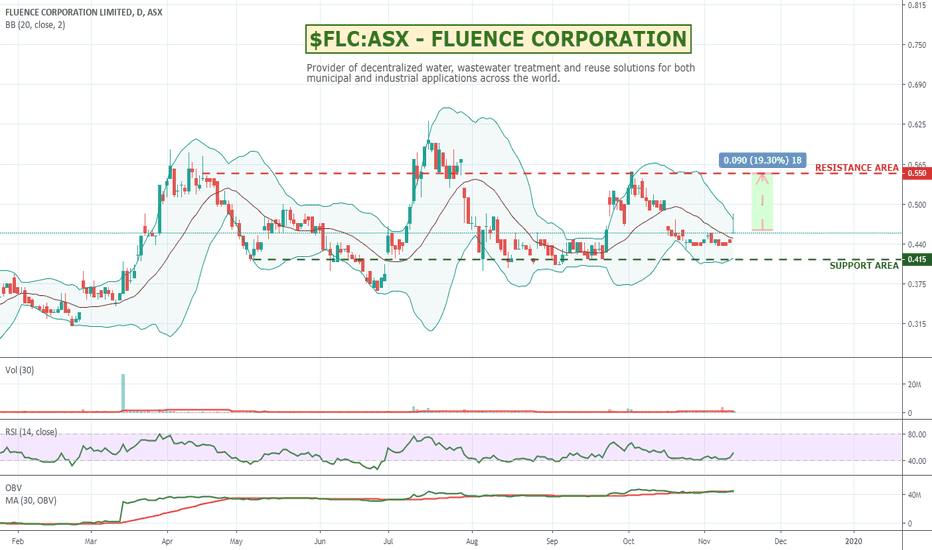
Formed a massive H & S pattern but ....Fluence Corporation chart has formed a massive H & S pattern and price is currently at the neckline. Price may get maintained due to a SPP that is currently open but the capital dilution has risks. IMHO it is looking a bit bearish but let us wait for the completion of the price movement at the neckline
FLC trade ideas
$FLC:ASX - FLUENCE CORPORATION - Water treatment businessFluence is a provider of decentralized water, wastewater treatment and reuse solutions for both municipal and industrial applications across the world. There seems to be some recent interest in this industry sector with some spectacular past performance of companies like Phoslock and SDV as examples. With droughts and pollution hot topics cleaning up of water ways and assisting desalination type plants as well as cleaning waters used by miners will all become more and more regulated with higher standards of quality being required to be met. It seems to trade within a bit of a range at the moment so could be worth a watch with tighter stops as it gets to the top of that range where resistance starts to kick in.
Fluence Corporation Ltd, formerly Emefcy Group Ltd, is an Israel-based company that is engaged in providing water treatment solutions. It offers decentralized, packaged water and wastewater treatment solutions. Its solutions include decentralized treatment, desalination, reuse, waste-to-energy, water treatment, wastewater treatment, food and beverage processing. It provides services and support for project financing and after-sale support. The Company offers water treatment products and wastewater treatment products. Water treatment products include NIROBOX SW, NIROBOX BW, ultrafiltration and reverse osmosis. Wastewater treatment includes MABR, NIRBOX WW, packaged plants, aeration equipment and dissolved air flotation. The Company operates in approximately 70 countries.
$FLC head and shoulders bottom $FLC Has a down trend since October 2016 however the recent heavy volume base suggests capitulation.
The pattern forming appears to be a head and shoulder bottom. To confirm the right shoulder will need to establish at around 36.5c giving a target of the move of 51c or ~40% upside.
The companies revenue growth appears to have hit a momentum stage with several larger scale contracts recently announced.
First Post - Breakout and showing support on volumeHi Guys
This is my first post. Only looked into TA recently but thought I would share something that I graphed out.
Fluence is a company that I have been following recently on recommendation from a friend
It was trading and bouncing off 38c for awhile but recently with its operational updates has broken out on volume. This pump had a healthy retrace recently and has settled in the mid 40s. I think that there is an invisible buy queue around 43c and that seems to be a new support floor.
Happy to get feedback on this and opinions as I only started charting a few weeks ago :)
Fluence Corporation - BUYMy first recommendation is Fluence Corporation.
Fluence corporation is a global leader in mid-sized, decentralized water and wastewater solutions.
From a fundamental and macro view , I like the stock as water, wastewater treatment and sustainability is an increasingly important topic in society. Increasing expenditure in water treatment is inevitable, China for example continues to provide significant expenditure in this sector, providing high revenue opportunities for Fluence. Why I like Fluence in particular is due to their MABR technology, which allows decentralized packaged treatment plants, which is a quick and cost effective for towns/cities to treat their wastewater without costly transport of fluids to the waste water treatment plants located 100kms away.
From a technical view , looking at the long term trend of the stock it has slowly trended down from a high of $1.00 to a low of $0.38 . With support eventually being found in the $0.38 price, where it has traded in a trading range between $0.38 and $0.46 for a solid 3 or 4 months. Quite recently the company has won a few new contracts and the stock has been in an uptrend to a new price of $0.48. The chart now displays a flag pattern between the prices of $0.45 and $0.48 indicating a possible breakout once the resistance of $0.5 is broken. Furthermore a new resistance line has formed according at its 200 day moving average price of $0.42 cents. This was confirmed on the 14th of August when the price dipped and rebounded back to its current flag pattern prices.
Overall, I believe this stock is a buy both from a fundamental and technical point of view.
Catalysts for a price increase are:
- Further contract wins
- Breakout past the $0.5 resistance mark
FLC Bullish Descending Wedge, MMAR Reversal = BO?The stock has been on a long and large bearish journey down a descending broadening wedge, however, it has begun showing the telltale signs of reversal as seen through the MMAR upward swings. Currently, it's undergoing a steep broadening descending wedge, which I suspect will bounce off the 50% fib at 46c. Just needs the volume.


