ASX:INR TO REGAIN LT UPTREND?Watching INR closely after recent bullish fundamental news regarding Ford Binding Offtake Agreement.
I have charted key levels of support and resistance as well as added in long-term and short-term trends.
Direction 1: Recently validating short-term uptrend and testing current daily resistance zone IF momentum continues it could regain long-term uptrend and eventually breach current daily resistance.
Direction 2: Short-term uptrend eventually breaks due to lack of bullish momentum and a selloff but manages to maintain support, eventually regaining long-term uptrend for a slower and more stable rally as it targets upper band downtrend resistance and ath resistance.
Direction 3: Short-term uptrend fails and price fails to regain long-term uptrend due to selloff, price manages to hold and validate daily support and moves sideways developing a short-term range.
Direction 4: Short-term trend fails and daily support fails, selloff increases and price moves back to the former low territory to find and validate a level of support.
Indicator RSI: Currently trending above the 50 midway mark and in Bullish territory. I will be watching closely to see which way momentum swings and see if it fails the current uptrend.
"DISCLAIMER: NO ADVICE. The information presented here is general in nature and is for education purposes only. Nothing should be considered to be advice. You should consult with an appropriate professional for specific advice tailored to your situation."
INR trade ideas

INR - Ioneer lithium due for a run?With all the small cap lithium explorers running lately (LKE, CXO, LTR), it seems like INR is being left behind. The news of the project being halted due to concerns by the authorities have been greatly overdone.
Ioneer is looking to produce lithium carbonate from its Rhyolite Ridge project in Nevada, North America. It has the advantage of being located in the USA where there are very few lithium (Li) projects. The USA is also the second biggest car market in the world. Geopolitical risks have put a spotlight on the supply chain for the EV companies in the USA.
What sets them apart is a hard rock deposit and making the lithium carbonate and boric acid onsite and selling the final chemical which has a higher value than shipping put the raw material. Most Li miners currently send out what they dig out to another country for processing.
Because the nature of the ore, the side effect of the process for leeching the Li and boron (B) produces the final product lithium carbonate, no intermediate steps are involved. You go from crushing the rock to producing the lithium carbonate in a continuous process. The refining process doe snot use any energy source from gas or electricity and uses the waste heat from the sulfuric acid plant onsite which is made for the leeching process. This makes the project have very attractive ESG credentials - uses low energy and low CO2 emissions, which is being sought after by many EV makers.
Recent concerns about issues with the project due to the rare plant species located in the proposed site has been over blown. Managing director Bernard Rowe has confirmed in a recent interview that they have been working closely relevant authorities and are in the process of updating the mine plan to reflect the small changes to allow the plants to be undisturbed. There is no other barriers or issues slowing down the project, once it is completed, they plan to move ahead to the final stage of the permitting process. This is a potential catalyst around the end of March when they anticipate to have the updates completed. The final permit is due to be completed by the end of the current calendar year which could be another catalyst.
Summary
• The next Li producer in the USA, will quadruple the existing Li production.
• Equity funding already in place and debt funding to be finalized.
• Have 2/3 critical permits to allow construction.
WHAT DOES THE CHART SAY??
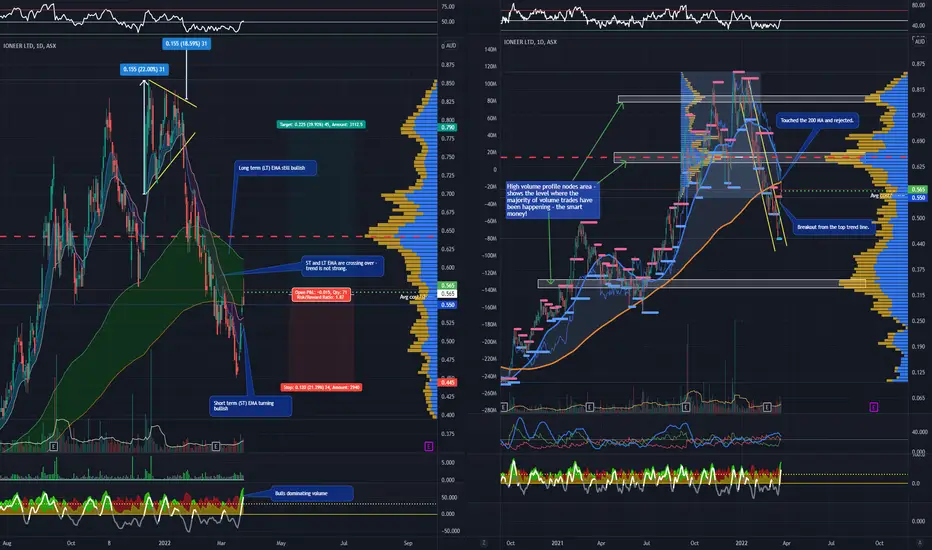
• The EMA's (see chart notes) are indicating a sideways or weak bullish trend at the moment.
• The price in the last couple of days has broken out of a trend line.
• Todays finish (intraday) retraced 78.6% from the open which is showing weakness.
• The bulls are dominating the volumes from the low pivot point.
• The vol profile node area 0.635 - 0.66 will be a key level to look out for. If the price hits this level and bounces down, expect the price momentum to continue down. If it breaks above this area, I expect some resistance in the next high vol node around 0.79.
Trade Thesis
• Looking to swing trade, holding for a few months up about a year. Let the thematic play out.
• Ideally I should wait a few more days to see what happens to the breakout as it is looking shaky atm. Also I should see how it reeacts when it hits the critical level around 0.635 - 0.66 as mentioned above.
• To ease my feeling of FOMO though - I have aggressively entered a small starting position today at 0.565. I believe in the thematic and I think it will last a bit longer yet. These type of stocks tend to run and then go sideways for a bit as I have learnt the hard way in other similar trades where I sold too early. So I am willing to observe this closely now that I have my starting position.
• At the moment, setting SL at 0.445 and TP 0.795, just before the ATH levels.

INR @ 19 Oct 2021Text me if you have any questions/comments for me.
-----
INR
- Previous analysis was done on 16 Sep (red arrow) -> suggested waiting for a successful rebound
- Since then, the stock created a LH and LL
- Stock rebounded off the mid-term support and successfully break out from the counter-trendline (blue dotted line) with above average volume
- Stock is currently near Previous High
- Price is far from the short- or mid-term supports
- R is more than 10%
- Strategy-to-buy (DYOR) – Suggest waiting for a successful retracement and successful rebound

INR @ 16 SEP 2021Text me if you have any questions/comments for me.
-----
INR
- Previous analysis was done on 31 Aug -> suggested waiting for retracement and successful rebound before plotting entry
- Since then, the stock flew like a rocket
- Today, the rocket’s parachute didn’t deploy -> Stock dropped almost 19% with above average volume
- Today’s price action is nothing new as stocks that have gone up a lot usually will have a sudden and sharp price reversal
- There is no structure break as of today but there is definitely a tear
- If the stock continues to break to the to the mid-term support or even falls below the 50-cent psychological support, there is not much hope left for the stock
- R is more than 10%
- Strategy-to-buy (DYOR) – Suggest waiting for a successful rebound

INR @ 31 Aug 2021INR
- First time doing a written analysis on INR
- History of good uptrends that tend to last 2-3 months
- Created new all-time high today
- Price is far from the short-term support –> best to wait for retracement and successful rebound
- R is more than 10%
- Strategy-to-buy (DYOR) – Suggest to wait for retracement and successful rebound before entering

INR - Cup & Handle- Lithium Stock - Mine is in the USALooks ready to pop.
Not Financial advice. Do your own research.

INR - Trade PlanINR is a healthy looking chart making higher highs and higher lows but it may face some resistance and lookss overbought. I would like to take a buy position if it retraces lower. My Buy Zone is between $0.340 - $0.360, which is also its trendline support. I will watch price action to get long in the zone. Lets see how it progresses.
Please note these are my own notes, by no means trading advice. Please do your own research before entering into any trade.

IONEER- Waiting for a possible pull back to buy interesting stock : to be positioned as buyer ASX:INR

INR:ASX - IONEER LTD - Low Cost US Lithium PlayIoneer has a Nevada US based Lithium and Boron project. A core mission of ioneer is to develop a sustainable U.S. based source of lithium and boric acid that can be efficiently produced and delivered to customers domestically and internationally. Lithium production at Rhyolite Ridge equates to supplying batteries for approximately 400,000 electric vehicles annually. Could be worth a look.


Gap up entry with poor risk control Interesting stock to watch here as it is reacting differently Aussie and South American lithium miners today in the asx.
Supply: Lots of bag holders from previous support and gap downs lining up to sell
Demand: Preference for vertical integration as car manufacturers wish to reduce supply chain risk? or just FOMO
Who knows.
Entry level: 0.12
Exit: 0.095

Another inverted H & S pattern that looks goodWhilst not visible on the chart the inverted H & S pattern has formed with support around the 78.6% fib retracement (of the move up that commenced in October 2016). This looks set for a move up. Keep an eye on the daily RSI which is at 67 though the weekly RSI is well under control.

