QAN trade ideas
QANTAS ShortQANTAS is now net short on the regression break.
I am considering this trade with limited risk allocated.


QAN shortQantas short on the regression break - The share has gone ex-div and it is not clear this is now the top.
I will not take this trade.

QAN is now ShortQAN is now net-short on the regression break.
There are many options in the market this morning, and I am not sure this is the best.

QANTAS (ASX) ShortQAN has running for a long time. Coming into the new year with large funds adjusting their fund allocation into 2025.
Time to short!

QAN moving higherQAN chart looks bullish.
massive surge in price late in 2024 means
insiders know something we dont.
I expect QAN to touch $12 in 2025 as oil will remain cheap as well as cost cutting.

QANTAS - Rising Wedge -Weekly chartCan buy for short term at CMP. But need to sell it at the top line. High chances of falling down in upcoming weeks/months after touching the above line. Chance of going down by breaking the lower line is also possible. If in that can see a good correction in Qantas - nearly 30%.
Cheers!

Australia Qantas Announces Great Results. Price drops 7%.Qantas has announced an interim underlying pre-tax profit of $1.43 billion in its first return to profitability since the coronavirus pandemic started. The airline's record first-half result was at the top end of its forecast , with revenue of $9.9 billion. All segments of its business turned profitable during the half year, led by Qantas Domestic, which recorded $785 million in earnings before interest and tax. Qantas expects travel demand to continue driving the recovery in 2023 and 2024, with domestic capacity set to exceed pre-Covid levels in the second half of 2023.
Good news is bad news again. Seems like an over reaction. Might be worth keeping an eye on.

ASX:QANTAS Uptrend still intact since 2013ASX:QAN other than the Covid blip, log chart showing uptrend since Dec 2013. RSI MACD turning bullish on the weekly. Jumping the gun here... will need to see the week's closing on Friday for confirmation.
Target: $7
Stop-loss: $5

qantas long QANseeing strong resitance at $5.25 if breaks that $5.85 is next level 10% gain, if gets through that resistance goes $6.73 for 30% gain time frame 6 months

QAN @ 9 NOV 2021Text me if you have any questions/comments for me.
-----
QAN
- Previous analysis was done on 26 Oct (red arrow) - Suggested waiting for a successful rebound at 5.80 levels before plotting entry
- Since then, the stock has successfully recovered and looks to be trading at a resistance
- Another retracement from here would create a strong Triple Top resistance
- R is borderline 10%
- Strategy-to-buy (DYOR) – Suggest entry at current levels if believe that breakout will be successful

QAN @ 26 OCT 2021Text me if you have any questions/comments for me.
-----
QAN
- Previous analysis was done on 26 Aug (red arrow) - Suggested waiting for a series of HHs and HLs to form before plotting entry
- Since then, the stock has created a series of HHs and HLs
- A support zone is forming at 5.50 levels –> a successful rebound to around 5.80 levels would strengthen the support zone
- R is less than 10%
- Strategy-to-buy (DYOR) – Suggest waiting for a successful rebound before plotting entry

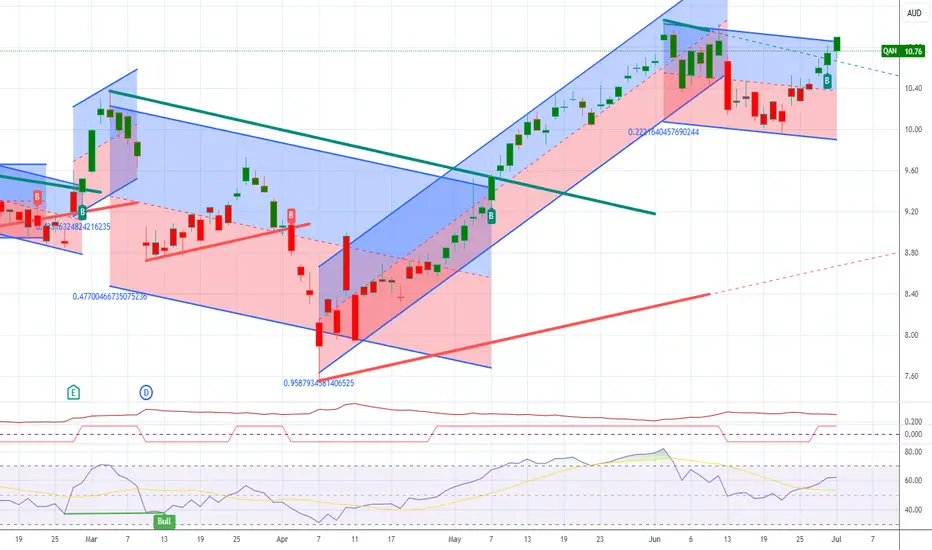
QANTAS LEVELSfor dad, mapped out important levels on the chart of QAN:ASX
- blue lines are areas where the price “gapped” up or down historically, also proved to be resistance for an entire year across 2015-2016, also made way for the recent bounce off the top of this range last month
- green lines are resistance/support that has been respected multiple times in the trading history of Qantas shares in 1999, 2002, 2017. Price is sitting just under the upper green line meaning it may want to return to the lower green line (10% lower), else needs some additional volume and a retest of the top of this area (similar to what happened with the blue lines) would look quite bullish to the upside targets
- orange line would be the immediate price target based on historical levels (daily, weekly and monthly). if it were to reach this, would likely see a strong reaction from the market with people who bought prices above this in late 2019 - early 2020 cutting losses here and anyone with entry prices below taking profits.
Added possible outcomes:
-blue (outcome 1) would see price go higher with some more volume, retest the top of the current range and hit region marked out with the green box (up 10%) just shy or around the price target of $6.30s.
-red (outcome 2) would see price return to the lower end of the current range (down 10%), with a bearish retest of the upper end of the range (below current levels)
-purple area below chart is the RSI, if it continues to respect the trend that begun in june 2015, it would top out again in the green box and head lower (leading to lower prices).
- another alternative would be to break out, however seems less likely over the course of a 6 year cycle that QAN is currently in. would expect at a best case scenario prices to top out between here and $6.30 before heading lower over the course of the coming months/years or a breakout from this 6-year cycle (would have to rechart to see where that would lead to)

QAN entering supply awaiting price action candlestick formation from bears, looking to short this into new lows but only if price action presents itself.. short aus200 index too..


QAN - Is the pullback Over?QAN had been retracing lower since the last two months and have found support just at the lower edge of the Parallel Channel (Trendline) ($4.40 - $4.50 Zone), coupled with Above Average Volume and a MACD Cross. It has retraced to exact 50% Fib Retracement and is showing some Bullish Price Action. This Bullish price action off Support suggests that the current pull back may be over and it could move higher to towards the Strong Resistance Zone of $5.20 - $5.30 for a potential 10% gain.
Please note these are my own notes, by no means trading advice. Please do your own research before entering into any trade.

QAN - bear flag setupQAN daily chart has shown the price gap has now filled.
hourly chart shows a bear flag setup
daily RSI shows a indicates a breakdown and
that price could follow lower soon.
buy back @ $2.

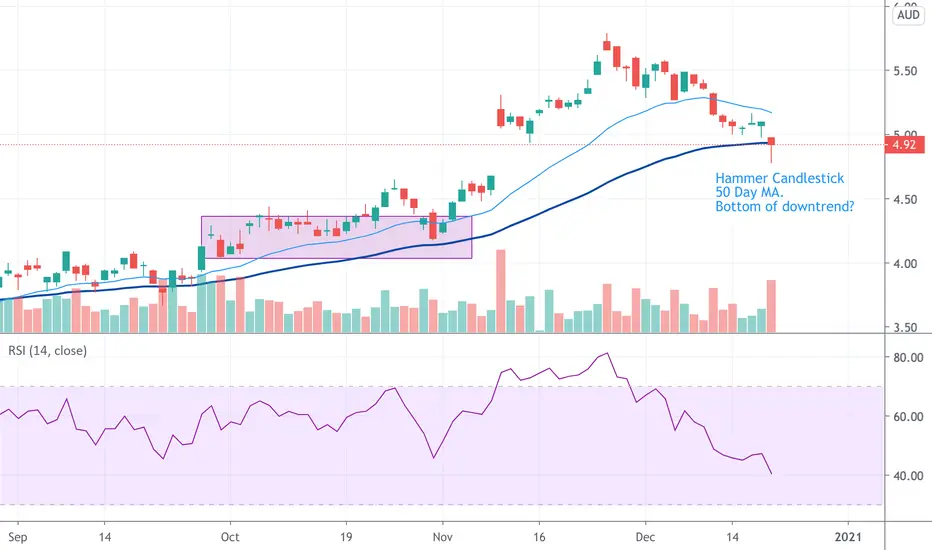
Hammer CandlestickQantas Slammed down with Sydney Covid outbreak killing flights.
Will see if hammer candlestick is right.

QAN - Nothing goes up in a straight line - Buying Opportunity QAN - another stock to suffer during the pandemic, but recent price action has confirmed a reversal by rocketing upwards and forming a higher high.
1. Price has formed a higher high
2. It has formed a Golden Cross
3. Recent sessions' price action, (Bearish Candles) indicates a pullback
4. I will be confident to buy in the $4.97 - $4.49 region (Buy Zone) as it is the 50% Fib Retracement Zone.
5. There is a gap window between 4.95 - $4.68 region (another confluence of Support)
6. There is a trendline support in the same region which is the third confluence.
Please note these are my own notes, by no means trading advice. Please do your own research before entering into any trade.


