Classic long Guppy GMMA and ADX #ASX #REAAnother beautiful sight to behold - the intersection of Guppy's GMMAs and ADX uniting into classic long indicators.
#ASX #REA
#MarketMonkey
#long
Next report date
—
Report period
—
EPS estimate
—
Revenue estimate
—
4.67 AUD
302.80 M AUD
1.68 B AUD
44.43 M
About REA GROUP LTD
Sector
Industry
CEO
Owen James Wilson
Website
Headquarters
Richmond
Founded
1995
ISIN
AU000000REA9
FIGI
BBG000C41NQ7
REA Group Ltd. engages in the provision of property and property-related services on websites and mobile apps across Australia and Asia. It operates through the Property & Online Advertising and Financial Services segments. The Property & Online Advertising segment derives revenue from Australia, Asia and North America operations. The Financial Services segment consists of commissions earned from mortgage broking and home financing solutions offered to consumers. The company was founded in 1995 and is headquartered in Richmond, Australia.
Related stocks

REA.ASX: 20 AUG, 2024© Master of Elliott Waves: Hua (Shane) Cuong, CEWA-M.
(1D) Details: Wave ((iii))-navy is unfolding to push higher. It is subdividing into wave (i)-orange, which will essentially continue to push higher. Any subsequent large decline would suggest that wave (ii)-orange is unfolding to push lower. Eve

REA.ASX: 09 JULY, 2024AUSTRALIAN STOCK: REA.ASX - 09 JULY, 2024
© Master of Elliott Wave Analysis: Hua (Shane) Cuong, CEWA-M (Master's Designation).
Forecast: Bullish
Wave (iii)-orange appears to be unfolding to push higher, while price must stay above 189.80 to sustain this outlook.
Invalidation point: 189.80

ASX - REA: 30 APR, 2024© Master of Elliott Wave Analysis: Hua (Shane) Cuong, CEWA-M
Details: The short-term outlook suggests that the 2-red wave appears to have recently completed as a Double Zigzag correction, and the 3-red wave may be ready to push higher. Further upward movement would confirm this outlook.
Invalidati


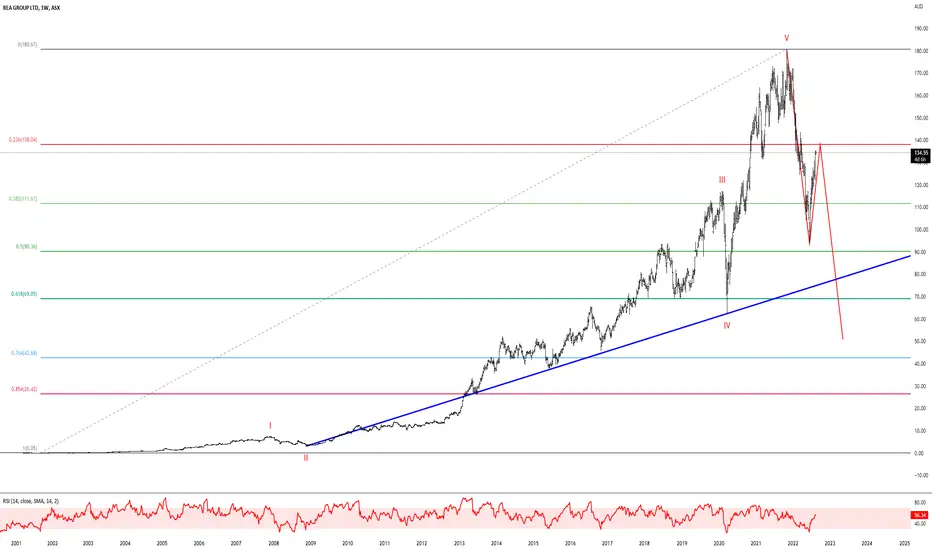
Bull Trap.Market is in the process of a large bull trap I believe - if timelines end up being correct expect a bottom early next year.
Nailing Bottoms On The Daily.tad more downside expected here - should bottom around $100~ @ centreline or next would be bottom of channel - break of channel to the upside would confirm the correction is over.


REA - Cup and Handle PatternKey Technicals - High probability trade here with the REA chart showing a Cup & handle pattern. Looking to buy on breakout (top of cup) with above average volume or on the breakout retest as resistance becomes support.
Key Fundamentals - Governments likely make sure housing recovery keeps on keepin

REA @ 23 SEP 2021Text me if you have any questions/comments for me.
-----
REA
- Previous analysis was done on 9 Sep - Suggested waiting for successful breakout of 170 resistance levels
- Since then, the stock has gone up 9% and broken through the counter-trendline (purple dotted line)
- 170 levels has been a resis

See all ideas
Summarizing what the indicators are suggesting.
Neutral
SellBuy
Strong sellStrong buy
Strong sellSellNeutralBuyStrong buy
Neutral
SellBuy
Strong sellStrong buy
Strong sellSellNeutralBuyStrong buy
Neutral
SellBuy
Strong sellStrong buy
Strong sellSellNeutralBuyStrong buy
An aggregate view of professional's ratings.
Neutral
SellBuy
Strong sellStrong buy
Strong sellSellNeutralBuyStrong buy
Neutral
SellBuy
Strong sellStrong buy
Strong sellSellNeutralBuyStrong buy
Neutral
SellBuy
Strong sellStrong buy
Strong sellSellNeutralBuyStrong buy
Displays a symbol's price movements over previous years to identify recurring trends.
Frequently Asked Questions
The current price of REA is 232.74 AUD — it has decreased by −2.81% in the past 24 hours. Watch REA GROUP LTD stock price performance more closely on the chart.
Depending on the exchange, the stock ticker may vary. For instance, on ASX exchange REA GROUP LTD stocks are traded under the ticker REA.
REA stock has fallen by −0.70% compared to the previous week, the month change is a −1.92% fall, over the last year REA GROUP LTD has showed a 11.97% increase.
We've gathered analysts' opinions on REA GROUP LTD future price: according to them, REA price has a max estimate of 290.00 AUD and a min estimate of 216.00 AUD. Watch REA chart and read a more detailed REA GROUP LTD stock forecast: see what analysts think of REA GROUP LTD and suggest that you do with its stocks.
REA stock is 3.23% volatile and has beta coefficient of 0.93. Track REA GROUP LTD stock price on the chart and check out the list of the most volatile stocks — is REA GROUP LTD there?
Today REA GROUP LTD has the market capitalization of 30.72 B, it has increased by 0.88% over the last week.
Yes, you can track REA GROUP LTD financials in yearly and quarterly reports right on TradingView.
REA GROUP LTD is going to release the next earnings report on Aug 6, 2025. Keep track of upcoming events with our Earnings Calendar.
REA earnings for the last half-year are 2.38 AUD per share, whereas the estimation was 2.33 AUD, resulting in a 2.00% surprise. The estimated earnings for the next half-year are 1.90 AUD per share. See more details about REA GROUP LTD earnings.
REA GROUP LTD revenue for the last half-year amounts to 872.90 M AUD, despite the estimated figure of 852.20 M AUD. In the next half-year revenue is expected to reach 800.47 M AUD.
REA net income for the last half-year is 441.30 M AUD, while the previous report showed 175.40 M AUD of net income which accounts for 151.60% change. Track more REA GROUP LTD financial stats to get the full picture.
REA GROUP LTD dividend yield was 0.96% in 2024, and payout ratio reached 82.43%. The year before the numbers were 1.10% and 58.59% correspondingly. See high-dividend stocks and find more opportunities for your portfolio.
As of Aug 2, 2025, the company has 3.41 K employees. See our rating of the largest employees — is REA GROUP LTD on this list?
EBITDA measures a company's operating performance, its growth signifies an improvement in the efficiency of a company. REA GROUP LTD EBITDA is 854.60 M AUD, and current EBITDA margin is 47.81%. See more stats in REA GROUP LTD financial statements.
Like other stocks, REA shares are traded on stock exchanges, e.g. Nasdaq, Nyse, Euronext, and the easiest way to buy them is through an online stock broker. To do this, you need to open an account and follow a broker's procedures, then start trading. You can trade REA GROUP LTD stock right from TradingView charts — choose your broker and connect to your account.
Investing in stocks requires a comprehensive research: you should carefully study all the available data, e.g. company's financials, related news, and its technical analysis. So REA GROUP LTD technincal analysis shows the sell today, and its 1 week rating is sell. Since market conditions are prone to changes, it's worth looking a bit further into the future — according to the 1 month rating REA GROUP LTD stock shows the buy signal. See more of REA GROUP LTD technicals for a more comprehensive analysis.
If you're still not sure, try looking for inspiration in our curated watchlists.
If you're still not sure, try looking for inspiration in our curated watchlists.