Ramelius Resources (ASX: RMS) –A Tactical Re-Entry Zone?🟡 Gold-Linked Opportunity: Ramelius Resources (ASX: RMS) – A Tactical Re-Entry Zone?
Context: Ramelius Resources, a mid-tier Aussie gold producer, is showing signs of technical exhaustion after a strong rally from its 2024 lows. With gold prices consolidating and RMS pulling back to a key support zone, this could be a tactical opportunity for shareholders and swing traders alike.
📊 Technical Snapshot:
Current Price: $2.47
Trendline Support: The long-term ascending trendline remains intact, offering a potential re-entry zone for bulls.
Risk-Reward Setup: Defined green/red zones highlight a favorable R:R ratio for those targeting a rebound toward $2.80–$3.00.
🪙 Gold Correlation Insight:
The inset chart shows gold (XAU/USD) stabilizing after a volatile June. If gold resumes its uptrend, RMS could follow suit, given its strong correlation with bullion prices.
🧠 Psychological Angle:
After a 40%+ rally from the $1.78 low, some profit-taking is natural. But this pullback may shake out weak hands before a continuation move.
Watch for sentiment shifts around gold and broader risk appetite—these could be catalysts for RMS’s next leg.
#RMS #Gold #ASX #MJTrading #Forex #Trading #Investment
RMS trade ideas

Potential outside week and bullish potential for RMSEntry conditions:
(i) higher share price for ASX:RMS above the level of the potential outside week noted on 31st January (i.e.: above the level of $2.48).
Stop loss for the trade would be:
(i) below the low of the outside week on 28th January (i.e.: below $2.26), should the trade activate.

Potential outside week and bullish potential for RMSEntry conditions:
(i) higher share price for ASX:RMS above the level of the potential outside week noted on 30th August (adjusted with the incidence of the inside week the following week, allowing activation of the trade above the level of the range for that week, i.e.: above the level of $2.20, as depicted by the blue dotted line and accompanying text on the chart).
Stop loss for the trade would be:
(i) below the swing low of 27th August (i.e.: below $2.02), should the trade activate.

Ramelius - Gold miner to go 36x if tri works Bullish case - Long term chart shows tri pattern and if the target is met it takes 3600% to get there
This relies and helps predict that the Gold price will over time move up much higher and the gold miners stocks like this one will go up
not advice just educational purposes

RMS - RAMELIUS RESOURCES LIMITED (UPSIDE POTENIAL)Giving upside potential base don Elliott wave analyst. Currently this in wave 3 of Elliott wave in weekly charts.


TRIANGLE BREAKOUT To long RMS
Trade setup : breakout of Triangle
LIKE
Candle breakout from the top range.
With healthy size candle
Decent volume compared to last 5-6 candle
Above EMA in trend
DISLIKE
Price did not followup to break with momentum
Came back to retest
Overall bearish sentiment of market during open

RMS bulldaily = invesrse head and shoulders
and breakout of pruple trend line.
GOLD sitting just under $2K US.
gold price breakout is imminent and
the miners WILL follow in suit.

ramelius resources RMSgetting good support on trend line at $1.36 if keeps consolidating for few days should go long to 1.62 for about 15% gain 3-4 week time frame

$RMSRMS breakout with target market on the change
RMS broke out on decent volume.
Looking for a move above the "level" and then to see if it uses that same level as support. this will be confirmation.
The next level is the target that is marked on the chart and a potential profit taking zone for short term traders.

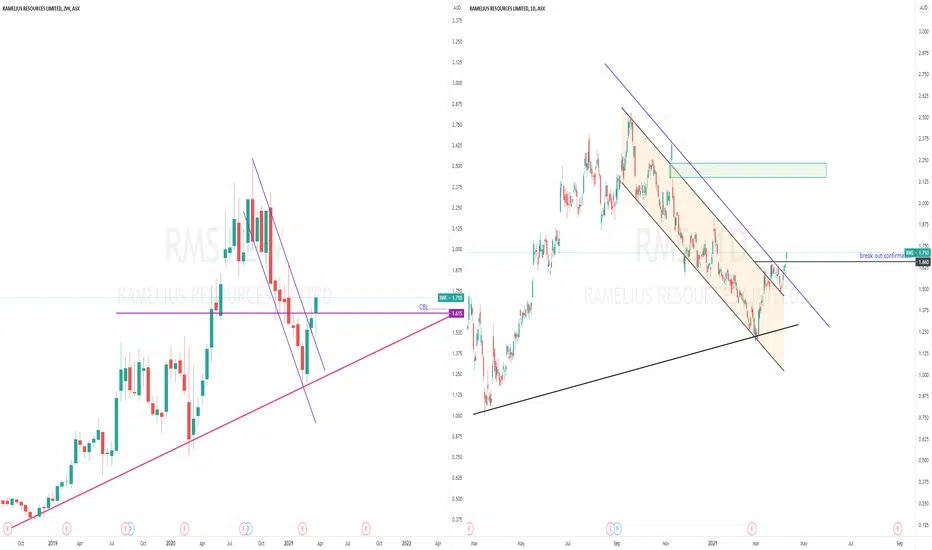
RMS looking bullishRMS has broken through a longer term trendline with some bullish implications.
The price control line for the bars shown is at 1.715 and there has been significant trading here and through to 1.80 (seen by volume histogram on the right)
Buying volume has stepped in this week and Twiggs Money Flow looks set top pop above zero.
As well the Stochastics are showing a very bullish posture with both the short and long term indicators showing a clear bullish bias to the upside. In contrast, you can see at Point A, only the short term Stochastic (in grey) carried the momentum up.
A bullish weekly close above 1.85 would see the bulls in control.


bullish setup for RMSRMS charts looking bullish like most ASX gold miners.
the downtrend in price has paused and price
is looking to initiate a new up trend.
wait for the confirmation break on daily chart
and load up.

RMS.AXGDX looking to reverse
Long list of these mid caps also looking to turn bullish after a 3 month downtrend
time is now on the retrace to take final positions
accumulate
should be a big wave (3) for 2021-22
cheers
Toby

RMS bullishdunno why theres a bug that never shows the correct timeframe
chart.
so i will show all 3.
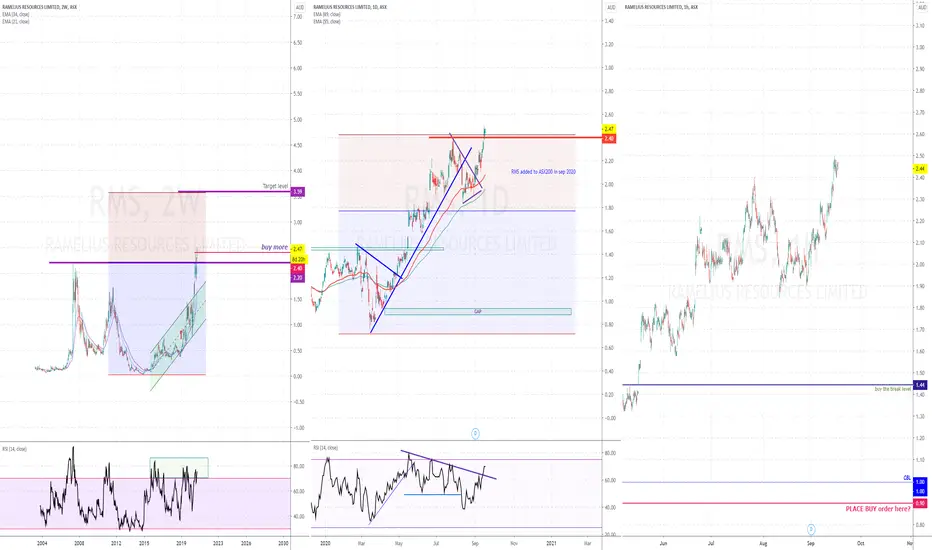
RMS bullish chartRMS added to asx200 recently.
funds will be forced to buy it.
just made all time new high.
long term target level is $3.60

$RMS 1.83 capper gets taken Im longg.Nice little bench formed up here, consoldation and now trying to push out froma 4 week base breakout.

Gold's looking BULLISH!I took a small position at 1.24 on RMS, on the chart 23/04 it's broken the trendline, putting the system and patience into practice.
Today I sold half of my position at 1.70 to de-risk my position and let the rest RIDE.

which way will it break?RMS has been going sideways for a while now. its been almost 1 year of consolidation. Soon we will find out if more buyers come in.

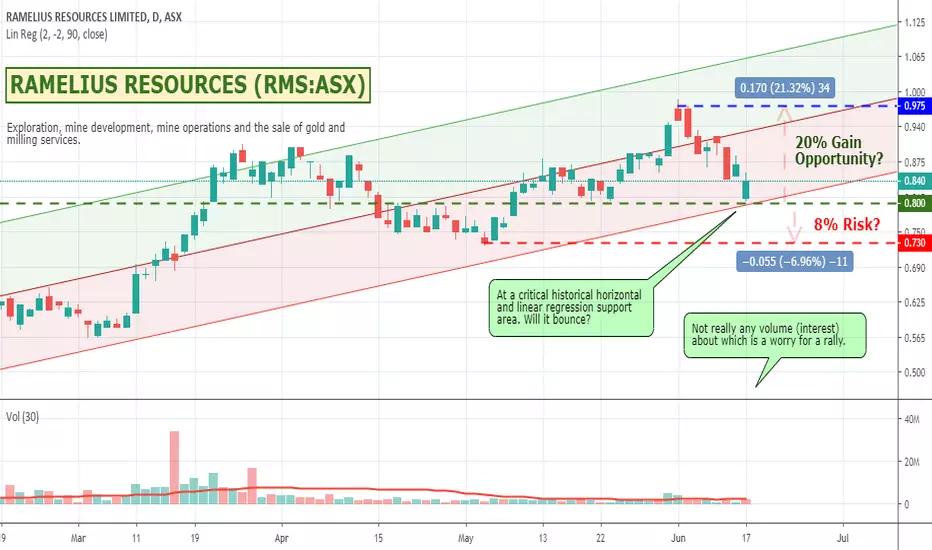
$RMS - RAMELIUS - Will it bounce?Hopefully has found support at the 80 cents mark on both the horizontal historical support level as well as the 90 day linear regression support trading range. Possible 20% upside to get back to the top of the channel. Risk of 8% or so if it breaks and heads down to the next support level. I already hold a few so will see where it goes. I have a stop loss at 75 cents but if it breaks below 79 cents I will probably look to sell. Might be worth a watch especially if it heads up tomorrow. Otherwise stay out or for me it's a sell :)
Ramelius Resources Limited is engaged in exploration, mine development, mine operations, the sale of gold and milling services. The Company's segments include Mt Magnet, Burbanks and Exploration. The Company's operational projects include Mt Magnet Mine, Kathleen Valley Mine and Vivien Mine. Its development projects include Blackmans and Water Tank Hill. Its exploration projects include Milkyway, Boorgardie Basin and Tanami Joint Venture Gold Project. The Mt Magnet gold project is located adjacent to the town of Mt Magnet, approximately 500 kilometers north-east of Perth in the Murchison Goldfield of the Western Australian Yilgarn Craton. The Blackmans gold project is located approximately 30 kilometers north of Mt Magnet, in Western Australia. The Water Tank Hill project lies over 1.5 kilometers west of Mt Magnet, in Western Australia. The Milkyway gold project is located approximately 3.6 kilometers southwest of the processing plant at Mt Magnet, Western Australia.