SBM Bullish to fill the gapTechnical Commentary – SBM (St Barbara Limited)
SBM has formed a textbook double bottom pattern, confirming a bullish reversal from prior downtrend conditions. The price action has since broken above neckline resistance and is now trending within a well-defined rising channel, supported by increasing volume and aligned moving averages.
The stock is currently targeting the next major supply zone around 44c, where a previous gap remains unfilled. The recent wave structure suggests a classic Elliott Wave impulse, with the current leg aiming for wave (5), coinciding with this resistance level.
Short-term momentum remains strong, with bullish alignment across the 20, 50, and 100-day moving averages. A break and close above 44c may signal a continuation toward higher resistance zones established in late 2023.
Key Levels:
Support: 33c–34c (previous resistance turned support)
Resistance: 44c (gap fill target)
Trend: Bullish above 30c
SBM trade ideas

$SBM Bullish after forming a double bottomExpect to see SBM move into the Box after making a bullish double bottom. Gold is also bullish at 3300 USD.

short term trade for SBMSBM sitting at bottom of the cycle.
It had a massive run in the past decade
but has fallen back. Sentiment is low
and i Feel all the sellers have been exhausted. Everyone who wants out
of SBM is out so expect a short term bounce.
Gold price making new highs will help.
technically this setup looks strong so
next target will be about 50 cents.
on the Macro side of things. The phony economic numbers are boosted by Govt
spending which is only surface level. intrinisically the economies of the world
have been in recession since 2019.
I suspect govt sectors and its rent seekers
to make up more than 50% of GDP.
The private sector is dead or moved to China.
Wars continue as the Empire tries to hang on. Wars are fundamentally inflationary.
Like Keyenes said . in the long run we're all dead.

Finer Market Points: ASX Top 10 Momentum Stocks: 10 Apr 2024GETTEX:M4M NYSE:MSB ASX:NXM ASX:AIS NYSE:MMC ASX:WR1 ASX:QOR CSEMA:SBM GETTEX:CBE NYSE:FND
Momentum leading shares are the market's best performers today. They are the fastest-growing shares on the ASX over the last 90 days. These companies can't get to be leaders without first appearing on our Launch Pad list.
The Launch Pad List is published weekly on Fridays.
Today's ASX's Top 10 Quarterly Momentum Stocks are:
Macro Metals Limited (M4M)
Mesoblast Limited (MSB)
Nexus Minerals Limited (NXM)
Aeris Resources Limited (AIS)
Mitre Mining Corporation Limited (MMC)
Winsome Resources Limited (WR1)
Qoria Limited (QOR)
St Barbara Limited (SBM)
Cobre Limited (CBE)
Findi Limited (FND)

$SBM 0.190 GOLD MC $145m cash at hand $236MHow this has stayed down for so long is pretty impressive, big boys play HARD
Cash balance of $236 million as at 30 September 2023 (0.30 ps)
Sure theyve had/got issues BUT they got cash money too
770m SOI
Aside from the funnymentals
Chart looks ready for a leg up with target at 30, nice lil gainer with the potential for a TO offer, ehh we'll see
14/12/23
In the open hour theyre already at double yesterdays total daily volume, id be exceptionally surprised if this doesnt hit beast mode today

SBM - ASX Gold MinerPrice resting on macro swing low.
RSI at lows of 30
Long towards $1 = TP
$5 macro target.
Gold ATH in AUD


buy SBM @ the lower boundSBM looks bad. sentiment is bad.
price is bad. buy the support level which is close.
10-20 cents is a good buying area. speculate on this on
and hope it doesnt end up like BDR, TRY or X64.
we need the gold price to move higher to lift
all these gold miners. when the price of gold rockets
higher even the lowly cruddy gold miner will rise too


SBM price @ supportthe 2 week chart shows
price @ long term support level.
see the yellow trend line.
expect some strong buying to coming into SBM
in the coming weeks.
i will take a punt and buy a small parcel
of SBM

SBM could be bottoming at these levels looking for a bounce.$SBM St Barbara pretty much following #gold, but could bounce from these levels. Relatively low PE, Price/Asset, 4%+ ff div. Substantial holders recently accumulating. Qtr coming up. $1.78 currently $sbm.ax

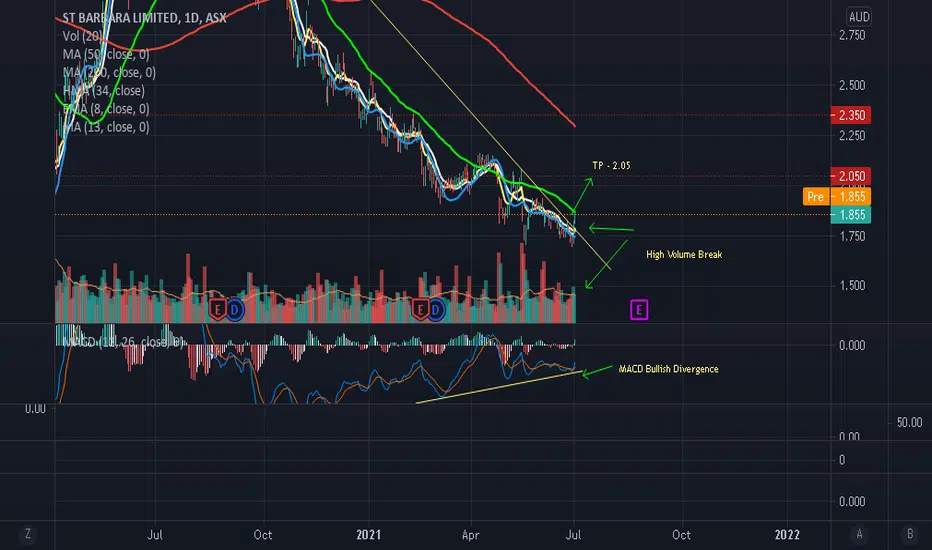
SBM - Trade PlanSBM has broken out of it downtrend line with High Volume indicating a possible change in trend. There is also MACD Bullish Divergence indicating a change in momentum. This shows that the risk to reward is on the upside. My plan is to target the initial resistance level of $2.05 (potential 10% gain) with a tight stop below the recent low.
Please note these are my own notes, by no means trading advice. Please do your own research before entering into any trade.
SBM at beginning of new bull phaseAfter the recent sell-off, we can see that SBM bounced strongly off the 200MA. Couple this with gold entering a multi-year bull market and $3 is looking cheap.


SBM breaking H2/H1 range at 50% fibBreaking out of an H1/H2 range. I like the volume increase that accompanied the gap up or the first attempt to break the range.
The range is at 50% fib.
H2 attached


ST BARBARA LIMITED double bottom? $SBMIs ST BARBARA LIMITED showing a double bottom?
It could be a good buying opportunity next week if Gold Prices continues to go higher.

SBM - ST BARBARA Share prices up 6.90% SBM - ST BARBARA Share prices up 6.90% at the time of reporting. Share prices reached highs of 3.55 in today's session before retreating and closing at 3.43. Share prices could continue to its next target at 3.65 if remains above 3.40 support. If it fails, we could see share prices fall to 3.30

Buy SBM SBM had a massive drop for the past 3 days, yesterday it recover of the support level. On the TA side its outside the BB, MACD, 13 and the 50 EMA are trying to catch up on the daily. On the weekly it bounce off nicely of the support level and the 200 EMA as well. looking for a 20 cent up side move on this stock.

sbm $4.10 looking ready to move on upSignificant divergence, which is good enough for me.
Last of the weak hands out by now...surely
FD holding

SBM.AX hit historical resistance2018.06.18 TA Report
Aussie Market Buy/Sell ratio = 0.44
Buys: 269 (13.1%)
Sells: 613 (29.7%)
Hold: 1179 (57.2%)
Let's see some history relative timing values by VectorVest on this stock:
18-Jun = 1.43
15-Jun = 1.40
14-Jun = 1.35
13-Jun = 1.27
12-Jun = 1.28
SBM.AX has a current Value of $5.29 per share, which is fairly valued compared to its Price of $4.97 per share. Value is computed from forecasted earnings per share, forecasted earnings growth, profitability, interest, and inflation rates.
RT analyzes a stock's price trend. SBM.AX has a Relative Timing of 1.43, which is excellent on a scale of 0.00 to 2.00. RT is computed from an analysis of the direction, magnitude, and dynamics of a stock's price movements day-over-day, week-over-week, quarter-over-quarter and year-over-year. If a trend dissipates, RT will gravitate toward 1.00.
As RT keeps rising in the last few days, it is a good sign.
Let’s have a look on the technical analysis for more information:
Bearish MACD Divergence Alert
The current price actions forming a bearish MACD Divergence, the highest price has hit $5.03 which was almost near historical high on 2010.11.08 and 2010.11.12.
We are not scaring people away for this stock. If you have an ichimoku graph handy, then you will see SBM.AX was climbing gradually to the mountain top, even above the green clouds, which are the good signs for longer run.
Alert still means an alert, you don’t have to take consideration to sell right now, unless you see some signs of bearish movement one or two days later.
From the trend line analysis, can you see there some more rooms for it to climb a bit more toward $6.0? Yes, there is a condition which is the resistance zone has been breached.
