SpySo.... I'm looking for a rebound this week early on from Smallcaps, banks, and cyclical. All last week everything non tech sold off.. it all started with TVC:NYA hitting this monthly trendline
As you can see, this has been resistance for about 5yrs and every time it has tagged , a correction has followed. To make matters worse , July monthly candle finished with a gravestone doji reversal. Monthly grave stone reversal means that the trend has likely flipped and for the next few months at least until Oct things will flip bearish for all things non tech.
but right now for this week, I think all things non tech gets a big bounce at least early on
Why do I say a bounce is coming? Well the hourly technicals for things non tech went way oversold. On top of that look at the daily BBand on NYA and AMEX:IWM
With standing World war 3 or Powell firing you will get smoked if you short this. This is why my favorite longs early this week are Smallcaps and banks.
Focusing on big tech..
If you didn't know that this market runs on a tech bubble then last weeks divergence was your wake up call.
Neither, Dow,IWM or NYA made a new high but the QQQ and spy did.
With that being said you will only know if the spy has topped by keeping track of the NASDAQ..
Qqq
Over the next 2weeks I think Qqq will retest that breakout of 538-540 which is around the 50ma
This drop will bring spy down to 610 retest.
But first I think there is extremely high chance Qqq retest it's 20sma to the upside at 560 to the upside before heading down
I prefer the short up there at 560 but be aware that price could trade between 550-560 to form a H&S
In a move of extreme fawkery we could get a double top instead
But that will only come off Qqq breaks back over 565
Overall, I don't really like big tech long this week. You may have some making moves but it will be a spotty picture with some green and most red or choppy.
The break below the 20sma on Qqq and all tech indexes
AMEX:XLK
NASDAQ:SMH
AMEX:XLC
Means the trend has changed to bearish.. as a trader one of the rules that has helped me is
Swing the trend and scalp the counter trend..
If the market is bullish then you swing calls and scalp puts.
If the market is bearish , you swing puts and scalps calls.
As far as swinging puts this week, just keep your eye on the 20ma of your favorite index/Stock. Once price retest the 20ma , that is the best entry for the short IMO.
The weekly bearish engulfing means that's by WED-Thurs you should stop trading calls and look for market to roll over for more downside.
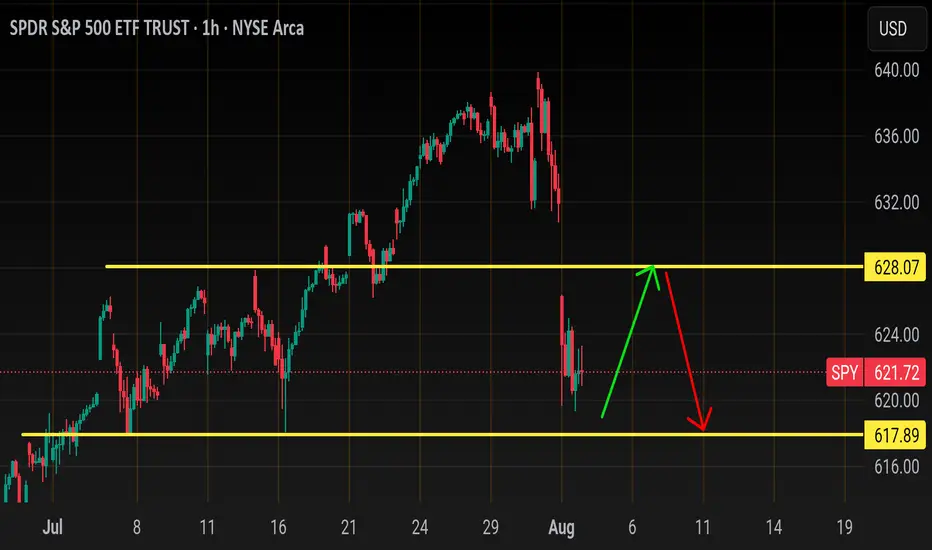
Spy
Hourly
As long as the market opens above 617, you want to scalp the long early in the week with your target of 626-628.
I don't know if they will close this gap or not, it will most likely depend on Qqq breaking above 560.
Below 617 and 610 comes.
If price pushes above 629 , I wouldn't chase calls here. That double bearish engulfing on daily Time frame is no joke, and price will likely no break above 640.
Trade idea of the week is
AMEX:IWM
200sma is at 216.50
Over 217.00 and I like calls to close gap at 219.40.
Price could push up to 20sma at 222 but from there I like the short back down targeting 210
SPY trade ideas
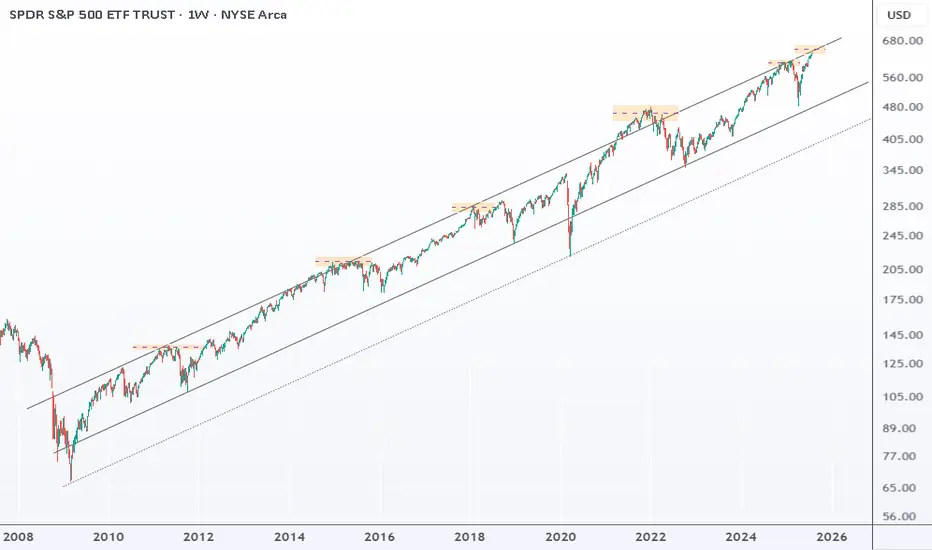
SPY : back near the top of its upward channelSPY is back near the top of its upward channel, a strong resistance.
Every time this happened since 2011, markets dropped 10–27%.
Still trending up, but this setup doesn’t look great.
Since the April low, SPY is up 30%, short-term trend is stretched and vulnerable.
Still undecidedEdged the top and bottom 4hr fibs. In a 4hr fvg. Idk. Anyone have any thoughts on this or nah

$SPY rolling over, potentially to new lows?While I was early to the idea (like usual), still don't think the thesis will be wrong. I still believe we're going to see a large move down from here.
Yesterday's price action made me pretty confident a top was in (TBD). We had positive news and the market couldn't rally on that positive news and we ended up closing at the lows -- indicating to me there's no more buyers.
Today we have treasuries, the dollar and volatility all rallying while equities selloff, a classic risk off signal. You also have crypto selling off too.
I think we see a large risk off move from here on out, the target is the $440 area (extreme down to $400), but if we find support at one of the other levels above that, there's potential for us to rally from there.
Will have to see how price action plays out over the coming weeks.
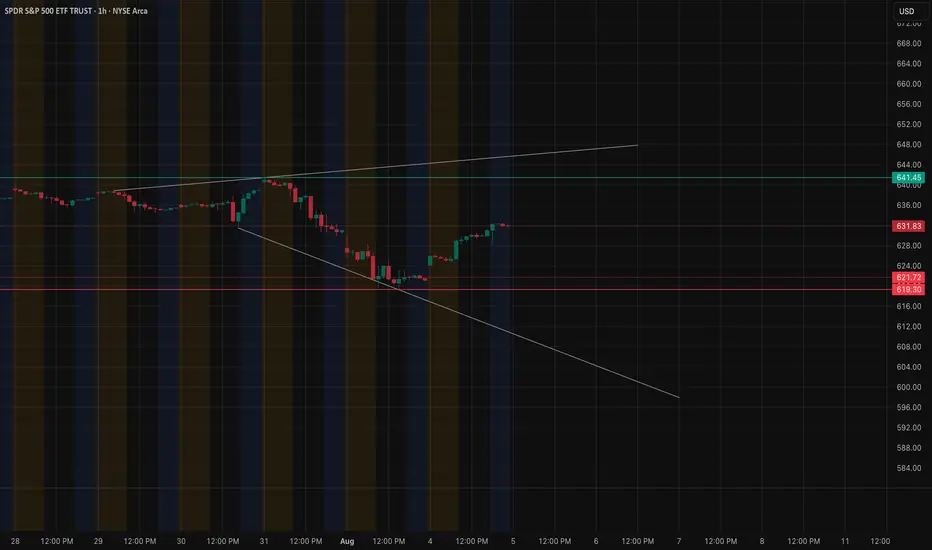
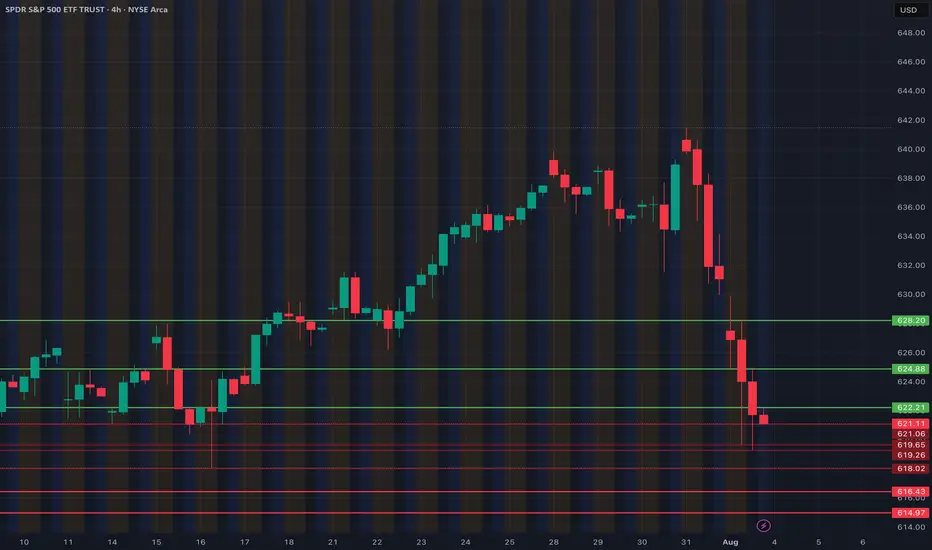
SPY – Bullish Recovery Faces Key Resistance. Aug. 5SPY – Bullish Recovery Faces Key Resistance 🚀
1H Technical Analysis & GEX Overview
SPY has staged a notable recovery from the recent pullback, breaking out of the descending channel and now pressing toward a key resistance cluster near 631–633. This zone aligns with the Highest Positive NETGEX and a 2nd Call Wall, making it a pivotal area to watch for continuation or rejection.
* Support Levels:
* 621–622 → Key structure support and HVL zone (08/04). Losing this could reopen downside toward 615 and 610.
* 615 / 610 → Next downside targets aligned with 2nd & 3rd Put Walls.
* Resistance Levels:
* 631–633 → GEX resistance & 2nd Call Wall; breakout here could fuel a run toward 640+.
GEX Insights
* Positive GEX builds above 628, signaling potential dealer hedging that could limit extreme upside but support gradual climbs.
* Negative GEX dominates under 621, suggesting increased downside momentum risk if price breaks support.
* Put positioning remains elevated at 81.3%, hinting at cautious sentiment but also squeeze potential if shorts get trapped.
Trade Scenarios
* Bullish Case:
* Break and close above 633 opens path to 640+.
* Options: Consider short-term Call spreads targeting 640 if breakout confirmed with strong volume.
* Bearish Case:
* Rejection from 631–633 and break below 621 could send SPY toward 615/610.
* Options: Put spreads targeting 615 with tight risk management.
15-Minute View (Intraday)
* Momentum is holding strong above VWAP, but intraday resistance at 631 is visible.
* A clear BOS above 631 with volume could trigger fast upside continuation intraday.
* Best scalp entries: pullbacks to 628–629 if defended as support.
Outlook
Bias leans cautiously bullish into the 631–633 test. Watch for confirmation on volume before chasing upside. If rejection occurs, expect choppy pullback toward 625–622 for a potential bounce.
Disclaimer: This analysis is for educational purposes only and not financial advice. Always do your own research and manage your risk before trading.
short IdeaLooking at the hourly chart, and I am noticing a head and shoulders build up.
day trade idea: 635 entry 637 stop 630 profit target
swing trade idea: short above 630 long below

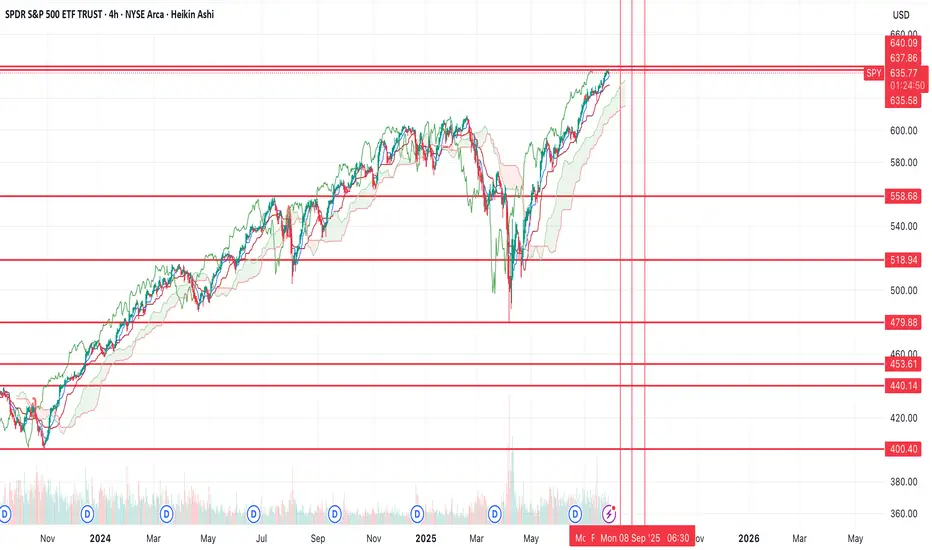
$UVXY Signaling Trouble — $SPY Could Drop 10%+ In this video, I discuss why August/September could bring serious downside for the market, despite my long-term bullish stance.
Right now, SPY is trading around $632, but I have a downside target of $573 in the short term. If we get volume beneath $573 — especially a break below the daily EMA — SPY could drop quickly, with a potential fall all the way to $480 in the coming weeks/months.
At the same time, UVXY is signaling a correction for the overall market after rallying from the low's of April. I have a target of $30 and when UVXY starts to move, it often reflects sharp market corrections — and the setup is beginning to mirror that now.
Despite this short-term bearish outlook, I want to make it clear: I am very bullish long term. Any 10–20% correction will be a major buying opportunity for me. I'm watching key levels closely and preparing to take advantage when the market overreacts.

The Current State and Future Direction Of The S&P 5006/9/24
Created By Joeseph Emanuel Dennis
Idea:
Critical area and critical moment in not only the NASDAQ but for the entire bull market otherwise we'll start a prolonged retracement or an unlikely bear market turnaround. My SPY target remains 600 based on previous positive FOMC, CPI, Job Report Data, Rate Cuts, Elections, and Current Institutional development. On the technical side, the higher high movement began at the start of 2023 my initial target was 480 and I was correct! after the September weekly retracement on SPY, we have been pushing higher despite January's negative economic data and the conflict with IRAN. The daily is set to move currently above the 20MA with the weekly bullish and the monthly extremely bullish. IMPORTANT WEEK AHEAD! the future data will determine if the bullish trend will progress onward FOMC meeting will either scare people out of the market or drive the market into a rally along with central bank stocks. My bet is bullish even though inflation is record high thanks to the Biden administration we somehow keep pushing higher makes you wonder if the positive economic data is even accurate is employment being at a record high is that a good thing? Many Americans find them selfs more with two jobs or even three jobs is that a positive thing? Underemployment is also at record highs are these post-college graduates getting the salary they deserve or are they settling with two low-wage jobs? Nonetheless, the bull market will rain on with a summer rally. I will keep watching in case something turns around the enemy isn't Jerome Powell it's the liars at the white house and the propaganda creators over at MSNBC.
Note: This goes for Bitcoin as well! 80K here we go!

SPY: Weekly and Monthly outlook for August Hey everyone,
As promised, here is my analysis on SPY for the week next week and the month of August.
As always, safe trades and take care!

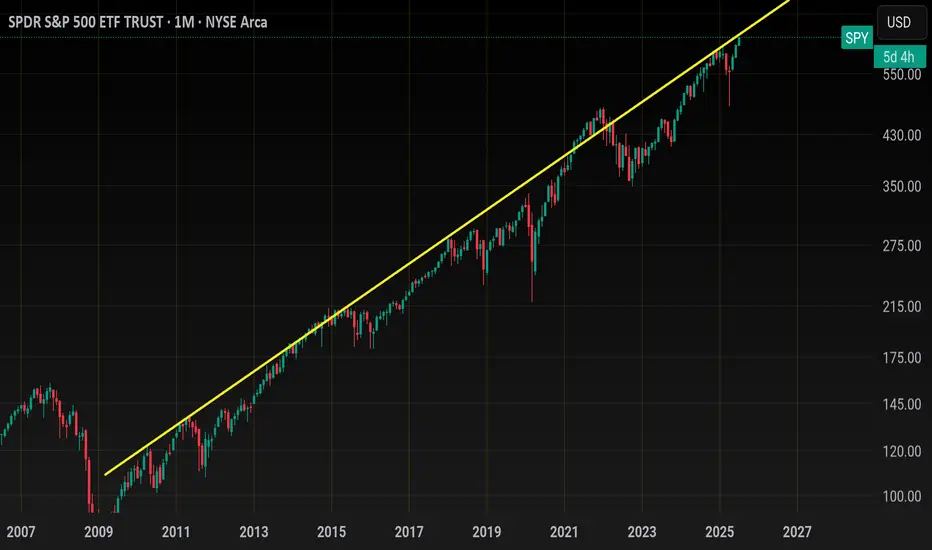
Spy.. 650 topLooking for a top this week
The top of this monthly trendline dating from 2009 should be tagged this week around 643-645.00. As you can see price can grind up here for weeks until the BIG drop.
That grind would possibly be distribution with
A range trade of 620-640 for the month of august. historically Sept is very bearish and could see a drop back below 600 then.
Summer price action looks like so
Smaller price action (Tradeable technicals)
Bull flag early July has us squeezing up this last leg here..
If we gap up Sunday night then i like the short around 638ish
If we gap down and flush i like the dip buy around 634 gap close with the next target being 640+
Daily candle closed outside Bbands so I would not long this on any gap up... on a big earnings week like this, there will be a shake out day or a flush to try and stop out all of those who bought long last week for this weeks earnings.
TVC:NYA or NYSE
Has also reached the top of its weekly channel here. 21,000 will be tough. Price could grind up here but I'd be careful trading anything non tech.
As far as tech goes
Here's NASDAQ:QQQ
monthly chart (Logarithmic)
We have room for 575-580
This should compliment Spy 550
Zoomed in on the daily chart and it's climbing back up to the resistance shown on the monthly
Hourly chart shows price action from early july... tight channel illustrates how frustrating the swings have been
562-563 is support heading into next week. If we have a major gap up Sunday night I would look to open short near 570 for a pullback before ER... if we gap down, I would buy the dip around 563 and average down if need be down to 561..
We should tag 575 this week
The sector that I think lags the most this week is the banking sector... AMEX:XLF
Banks outperform the entire market last week and are overheated at resistance I think they lag this week
I will update this more throughout the week if necessary..
SPYThe red lines are major swing points & levels in price action going down for puts vs the green line which are the same vs their going up for calls
THE STOCK MARKET IS BULLISH BUT NEEDS A SMALL CORRECTIONIn this video, we look at the weekly chart of the S&P 500 to determine if a correction is near and spoiler alert. Yes, it is. Here's what happens.

Nightly $SPY / $SPX Scenarios for July 30, 2025🔮 Nightly AMEX:SPY / SP:SPX Scenarios for July 30, 2025 🔮
🌍 Market‑Moving News 🌍
🧭 Fed Holds Steady Amid Uncertainty
As the FOMC enters its July 29–30 meeting, the Fed is expected to keep rates unchanged at 4.25%–4.50%, even as one or two governors may dissent in favor of rate cuts amid mixed economic data. Recent strength in consumer spending contrasts with weakness in housing and construction.
🌐 U.S.–China Trade Talks Resumed in Stockholm
Talks are under way aimed at extending the tariff truce before the August 12 deadline. Both sides described progress as constructive, though analysts remain cautious on the timeline and potential outcomes.
🛢️ Oil Up / Dollar Firmer, But Risks Remain
Brent crude hit ~$72.50/barrel (+3.5%) while WTI rose to ~$69.20 on a mix of geopolitical tension (possible new Russia tariffs) and trade optimism. The U.S. dollar edged higher following the U.S.–EU trade agreement.
📈 IMF Revises Up Global Growth—but Flags Tariff Risks
The IMF raised its 2025 growth forecast to 3.0% and maintained 3.1% for 2026, citing pre-emptive consumer demand—but warned that ongoing U.S. tariffs and policy inconsistency could dampen momentum.
📊 Key Data Releases & Events 📊
📅 Wednesday, July 30:
FOMC Rate Decision & Powell Press Conference
The Fed is expected to hold interest rates steady. Powell’s remarks will be closely watched for signals on the timing of future cuts and views on inflation and labor markets.
Advance Q2 U.S. GDP Estimate
The first look at Q2 growth is expected around +1.9% YoY, potentially validating a rebound after Q1’s contraction.
June PCE & Core PCE (Personal Consumption Expenditures Index)
The Fed's preferred inflation gauge. Markets will monitor if core inflation remains elevated, which may reinforce policy caution.
⚠️ Disclaimer:
This summary is for educational and informational purposes only—it is not financial advice. Always consult a licensed financial advisor before making investment decisions.
📌 #trading #stockmarket #economy #Fed #GDP #inflation #trade #tariffs #markets
SPY to continue fallingSPY reached a top (resistance) fork line and started to fall. Based on this I entered long on VIX on July 28, when VIX was at its lowest point. I expect this fall of the market to continue.
$SPY – FOMC Risk Window: AI Predicts Downside Drift📅 Forecast Window: July 30 – August 30, 2025
📡 Powered by VolanX Protocol v3.0 | WaverVanir DSS
🏛️ MACRO SETUP – JULY 31 FOMC:
🏦 Fed Funds Rate: 5.50% (expected hold)
🧊 Inflation: Cooling but sticky (CPI ~3.2%, PCE ~2.6%)
💼 Labor Market: Slowing but not collapsing
📈 CME FedWatch: 91% odds of no hike, but tone may be hawkish
🧠 Key Risk: Liquidity compression or prolonged pause = risk-off conditions
🧠 VOLANX PROTOCOL FORECAST (30-Day):
🔸 Current Price: $636.29
🔹 AI Target: $627.46 (−1.4%)
🟠 Signal: HOLD
🧮 Direction Accuracy: 85.5%
⚠️ Model Confidence: −2.049 (bearish drift)
📊 Volatility Forecast: Low (~1.36%) = slow bleed conditions
📉 WAVERVANIR DSS SIGNAL:
🔸 Sentiment Score: 78
🔻 15D Forecast: $630.49 (−0.8%)
🔻 30D Forecast: $616.68 (−2.9%)
📉 Bias: Mild Bearish
🛑 Signal: Hedge exposure, reduce risk, do not chase longs
🔥 OPTIONS FLOW SNAPSHOT:
🚨 $1.53M Call Sweep (645C, Aug 8) = Speculative breakout bet
📉 Multiple Put Sweeps (633–634P, Aug 4) = Institutional hedging
🟢 Mid-dated 638C/645C flows (Aug 15–22) show straddle-the-news positioning
📐 TECHNICAL ZONES TO WATCH:
📉 Support Levels:
$627 = Fib + VolanX AI Target
$616 = DSS Forecast + liquidity pivot
📈 Resistance Levels:
$639 → Gap close
$645 → Major breakout trigger (options magnet)
🕯️ Structure: Distribution bias → No clear momentum unless Fed surprises dovish
🎯 STRATEGIC OUTLOOK:
Scenario Probability SPY Reaction
🟡 Hawkish Hold 65% Pullback toward $627
⚪ Neutral Hold 25% Choppy → $639 max
🟢 Dovish Surprise 10% Spike to $645+
📌 VolanX Protocol Guidance:
"This is a defense window. AI models and options flow both suggest uncertainty, not conviction. Trim longs, hedge risk, and wait for post-FOMC confirmation."
#SPY #VolanX #WaverVanir #FOMC #MacroForecast #OptionsFlow #DSS #SMC #LiquidityTraps #SmartMoney #TradingSignals #AITrading #FederalReserve #TechEarnings #RiskWindow #HawkishFed #FedHold #MacroAI
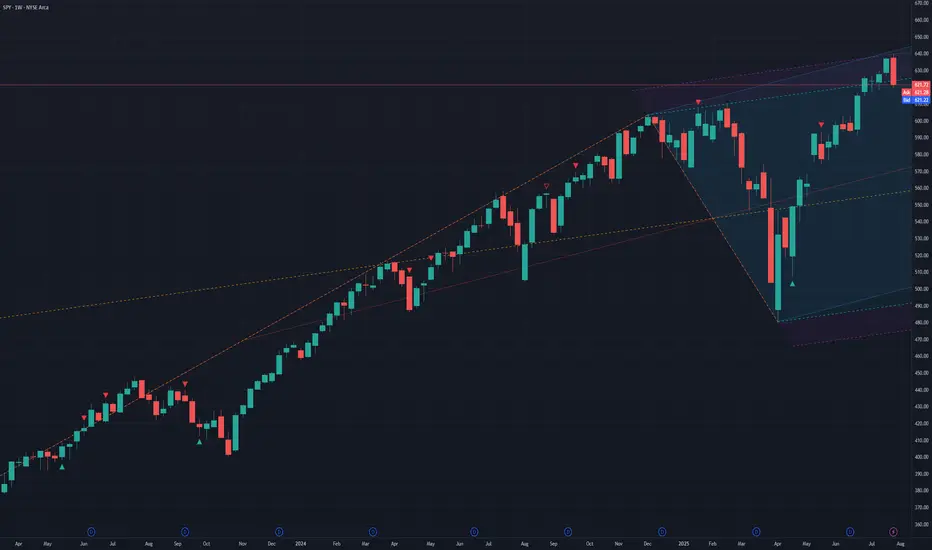
Next Leg down startingThe S&P 500 has been trading inside this rising channel for the last 3 and a half years. As you can see it has bounced off the bottom of the rising channel 4 different times and it is now back at the top of the channel. Price action gapped above the channel overnight but immediately sold off pre-market back inside the channel and completely reversed the move despite strong earnings from MSFT and META. This is very bearish and signals a move back down to the bottom of the channel once again and given that its already bounced off the bottom of the channel 4 different times, a 5th hit would have a high probability of breaking below the channel, which I would give a greater than 70% probability of playing out. If this happens, we will see much lower prices in this coming bear market.

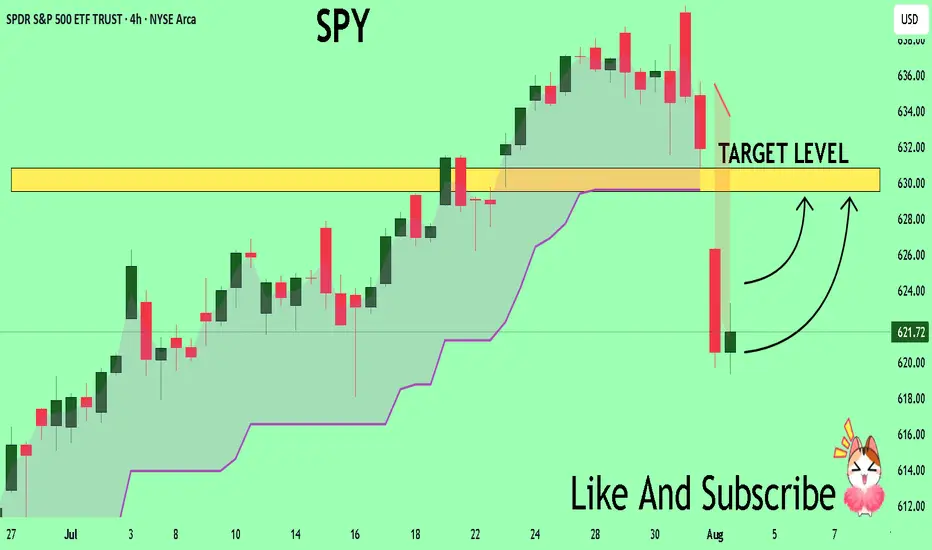
SPY Massive Long! BUY!
My dear subscribers,
My technical analysis for SPY is below:
The price is coiling around a solid key level - 621.72
Bias - Bullish
Technical Indicators: Pivot Points Low anticipates a potential price reversal.
Super trend shows a clear buy, giving a perfect indicators' convergence.
Goal - 629.55
About Used Indicators:
By the very nature of the supertrend indicator, it offers firm support and resistance levels for traders to enter and exit trades. Additionally, it also provides signals for setting stop losses
Disclosure: I am part of Trade Nation's Influencer program and receive a monthly fee for using their TradingView charts in my analysis.
———————————
WISH YOU ALL LUCK
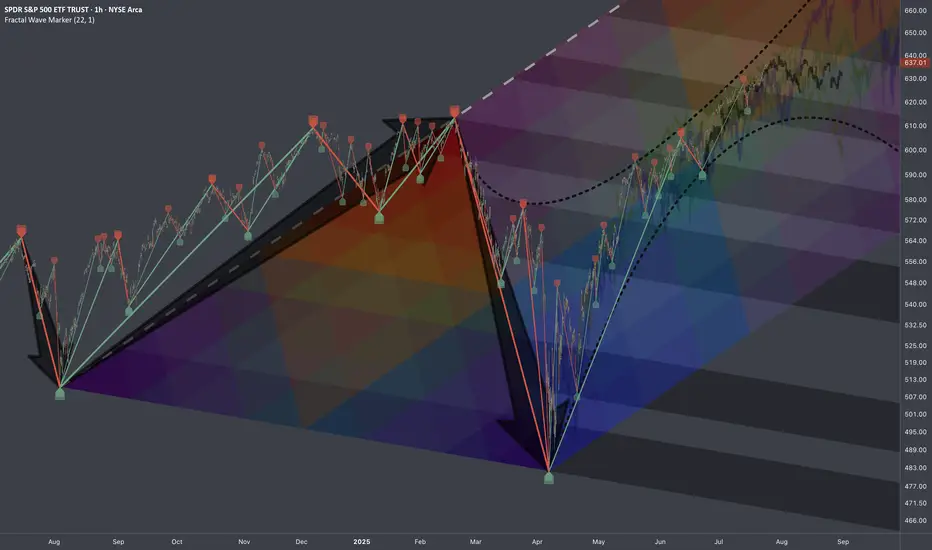
$SPY: Mapping Scenarios🏛️ Research Notes
Fractal Corridors
Shows recursive formations which indicates a full fractal cycle.
The angles of decline are parallel which is important for potential buildup.
To map a cycle we'd need to apply fib channel to the opposite direction In a way this should be sufficient to cover the scenarios of nearest future if we were to use bar patterns to validate a structure.
These are examples of historic progressions with similar growth patterns (composite sub-cycles):
This explains most elements present in interactive chart.
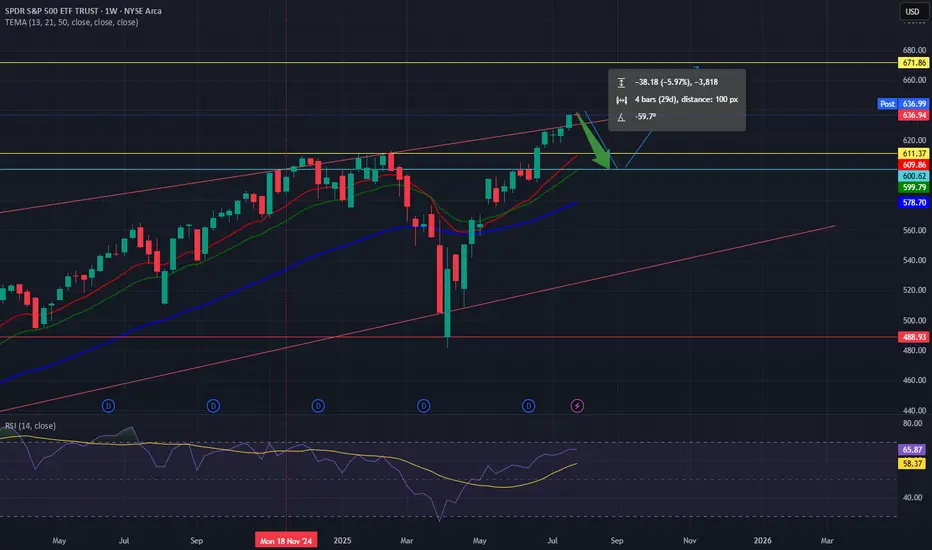
SPY Weekly Chart: Rising Wedge Signals Imminent PullbackSPY Weekly Chart Overview (Current Price: ~637)
🧭 Context:
Indicators: TEMA (13/21/50) & RSI (14)
Price is extended, RSI near overbought (65.87), and forming a rising wedge — a bearish pattern.
🔻 Bearish Setup: Rising wedge signals possible reversal.
Momentum weakening despite higher highs.
Price extended above TEMA — a 600–610 pullback looks likely.
📊 Key Levels:Resistance: 672
Support: 611–600 → 578 → 488
Break below 600 could trigger broad downside.
🟢 Bullish Case:
Breakout above 672 with volume = momentum continuation (AI/FOMO driven).
🎯 Conclusion:
SPY is technically stretched. Risk/reward favors caution.
Watch for pullback to 600–610
A potential Swing Trade soon on SPY!?OptionsMastery:
🔉Sound on!🔉
📣Make sure to watch fullscreen!📣
Thank you as always for watching my videos. I hope that you learned something very educational! Please feel free to like, share, and comment on this post. Remember only risk what you are willing to lose. Trading is very risky but it can change your life!

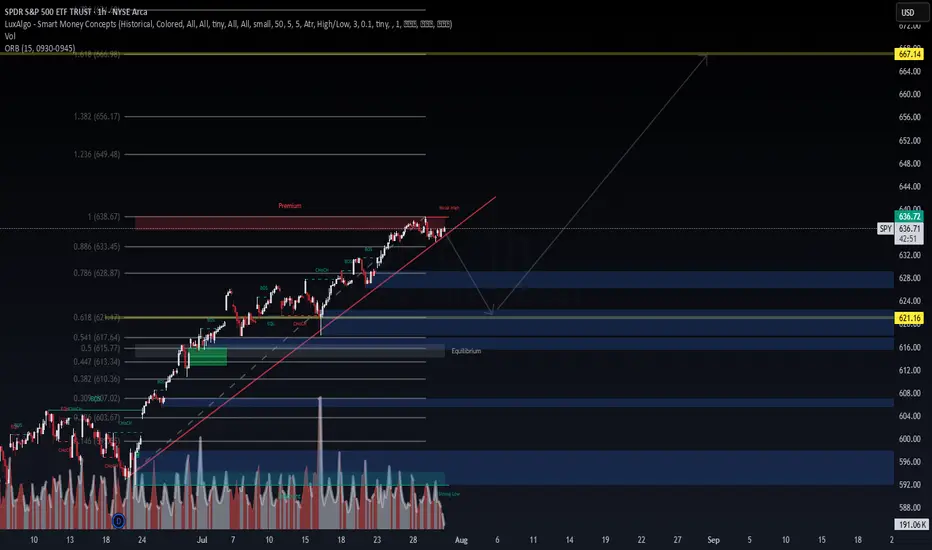
SPY: I think dollar milkshake is brewing, buying for long term📉 SPY Daily Breakdown – Aug 1, 2025 | VolanX Observations
🧠 Bot failed today, but the market taught more than any trade could have. Sitting out gave me the clarity to reassess structure and edge.
🔍 Market Structure Update:
Gap Down from Premium Zone: Today’s price action rejected the weak high and created a clean daily gap — signaling potential distribution at the top.
ORB (15-min) marked and ready: Likely to be retested on Monday. If price rallies into this zone and rejects, that’s where I’ll look for short entries.
Friday Bearish Close Rule: Statistically, when Friday closes red with strong momentum, Monday tends to follow — especially after a gap-down open.
🧭 Big Picture Outlook:
Liquidity Zones Below:
600 → First institutional reaction zone.
580 → Deeper demand and equilibrium area from previous consolidation.
Dollar Milkshake Brewing: Strong USD thesis could pressure equities short-term. This aligns with potential flow into defensives and out of high beta.
Long-Term Bias: Watching for deep discounts. If price moves into high-value demand zones, I’ll accumulate for the long haul — buying fear when it's priced in.
📌 What I’m Watching Next Week:
Monday open – will we see Gap & Go or a Gap Fill + Fade?
Reaction to ORB zone.
Volatility behavior and volume footprint in the first 90 minutes.
🔻 No trades today due to a bot error, but ironically, that gave me better vision. Sometimes, the best trades are the ones you don’t take.
VolanX Protocol engaged. Standing by.

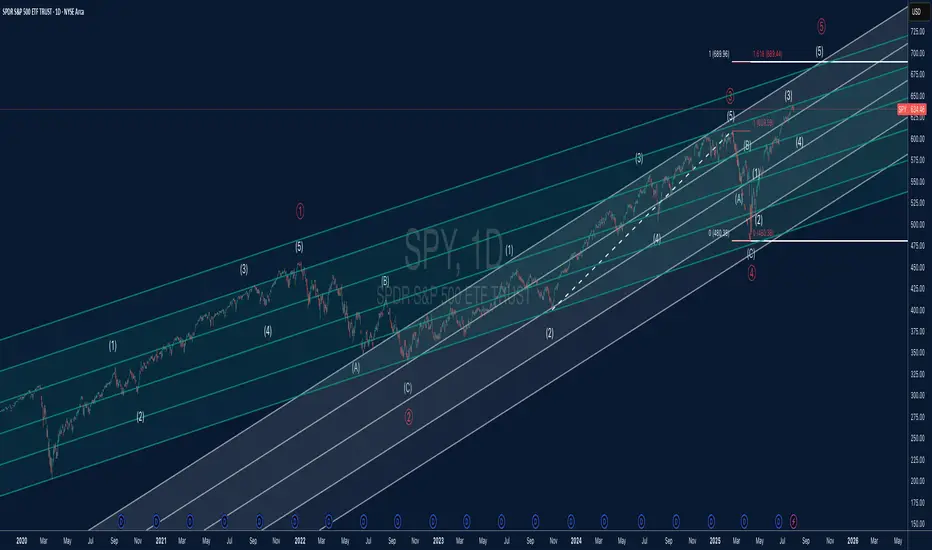
SPY Elliott Wave + Parallel Channel AnalysisThis chart offers a detailed Elliott Wave count for SPY (S&P 500 ETF) on the daily timeframe, combined with a structured parallel channel system to highlight key trend dynamics.
🔍 Elliott Wave Structure:
The price is currently advancing in what appears to be Wave (5) of Primary Wave ⑤, suggesting we may be in the late stages of a major impulsive cycle.
Each impulsive and corrective wave is clearly labeled, with the internal structure confirming classic Elliott Wave symmetry.
The 1.618 Fibonacci extension around $689 marks a critical upside target and potential completion zone for Wave (5).
Wave (4) held well at the lower channel boundary and completed near $480, establishing a solid base for the current advance.
📊 Channel Insights:
A system of parallel channels is applied to capture the overall trend and momentum structure.
Price is climbing toward the upper boundary of the long-term ascending channel, which has acted as dynamic resistance in previous waves.
The median lines have provided reliable support and resistance throughout the trend, making them important reference levels moving forward.
⚠️ Key Technical Levels:
Resistance: $689.44 (Wave ⑤ target at 1.618 Fib extension)
Support Zones: $609 (prior Wave (3) high), $575 (mid-channel support), and $480 (major cycle low)
A confirmed break above $690 could suggest a parabolic move, but risk of reversal grows as the upper channel is tested.
📈 Market Outlook:
SPY remains in a strong uptrend but is nearing a major confluence of wave and channel resistance.
A completed five-wave sequence would suggest the potential for a higher-degree correction, possibly leading into a Wave A/B/C scenario.
Short-term bullish bias remains valid while above $609, but watch for divergence or exhaustion signs near $689–$700.
Stock Market Forecast | TSLA NVDA AAPL AMZN META MSFTStock Market Forecast | CME_MINI:NQ1! CME_MINI:ES1! SPY QQQ
Mag 7 Forecast | NASDAQ:TSLA NASDAQ:NVDA AAPL AMZN META MSFT GOOG
