short IdeaLooking at the hourly chart, and I am noticing a head and shoulders build up.
day trade idea: 635 entry 637 stop 630 profit target
swing trade idea: short above 630 long below
SPY trade ideas

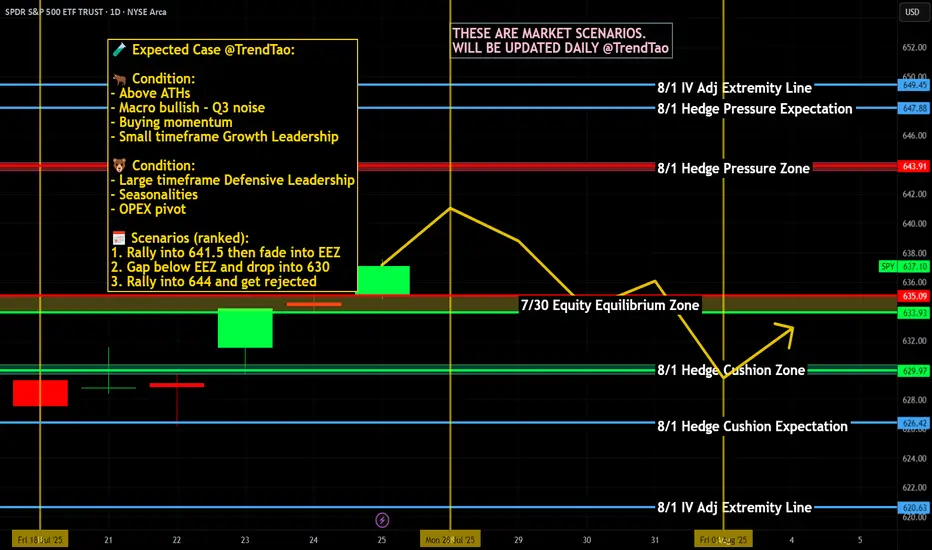
Nightly $SPY / $SPX Scenarios for August 1, 2025🔮 Nightly AMEX:SPY / SP:SPX Scenarios for August 1, 2025 🔮
🌍 Market-Moving News 🌍
📦 U.S. Imposes New Tariffs as Deadline Passes
Fresh tariffs rolled out on August 1 hitting major exporters: 25% on Indian goods, 20% on Taiwan, 19% on Thailand, and 15% on South Korea. Canadas tariff elevated to 35%, though Mexico got extra negotiation time. Global equity markets slipped modestly, led by declines in Asia-Pacific regions. AMEX:SPY futures also eased on mounting geopolitical and trade pressures.
🏦 Fed Uncertainty Mounts Despite Calm GDP
Despite robust Q2 GDP growth and a hold on interest rates this week, Fed Chair Jerome Powell faced growing unrest. Comments acknowledged downside labor risk amid trade uncertainty—investors are now assigning just a 39% chance of a rate cut in September.
📊 Key Data Releases & Events 📊
📅 Friday, August 1:
8:30 AM ET – Nonfarm Payrolls (July):
Payrolls rose by 106,000, less than June’s 147,000 but still positive. Wage growth slowed, easing inflation concerns slightly.
8:30 AM ET – Unemployment Rate:
Unemployment ticked up to 4.2%, from 4.1% in June—reflecting modest labor softness.
8:30 AM ET – Average Hourly Earnings (MoM):
Wages rose +0.2%, down from +0.4% in June, signaling wage pressure easing.
⚠️ Disclaimer:
This information is provided for educational and informational purposes only and should not be construed as financial advice. Always consult a licensed financial advisor before making investment decisions.
📌 #trading #stockmarket #economy #jobs #Fed #tariffs #inflation #technicalanalysis

SPY Stuck Below Downtrend Resistance. TA for Aug. 6SPY Stuck Below Downtrend Resistance – Sellers Still Pressing
Market Structure (1H View)
* SPY continues to trade inside a descending channel, with repeated failures near the upper trendline around $641–$644.
* Recent price action shows a lower high rejection followed by consolidation under resistance, signaling a cautious market tone.
* The macro downtrend remains intact unless bulls can break and hold above the descending trendline.
Key Price Levels
* Immediate Resistance: $631 (local reaction high)
* Major Resistance: $641–$644 (trendline + prior supply zone)
* Support Zone: $619–$620 (key demand zone)
* Deeper Support: $603–$605 (previous low and psychological support)
Indicators
* MACD: Recently flipped bearish with red momentum bars increasing — suggests momentum is shifting back toward sellers.
* Stoch RSI: Oversold bounce attempt possible, but currently still near the lower range.
* Trendlines: Price remains capped under the descending resistance line.
Current Bias
SPY is struggling to sustain bullish momentum after the recent push into resistance. Sellers are defending the upper channel, keeping pressure on the downside toward $620.
Scenarios to Watch
🟢 Bullish Case:
* Break & close above $631 with follow-through volume → retest $641–$644.
* Needs strong buying interest to flip the macro trend bias.
🔴 Bearish Case:
* Failure to reclaim $631 + sustained weakness could send price back toward $620 support.
* If $620 breaks, risk increases for a sharper drop toward $603–$605.
Trade Ideas (Not Financial Advice)
* Short Bias: Look for rejection near $631 or the trendline; target $620, then $605 if breakdown accelerates.
* Long Setup: Only if price reclaims $631 convincingly and breaks the $641–$644 resistance zone.
📌 Final Thoughts
SPY remains bearish-biased inside a descending channel. Bulls need a decisive breakout above $641 to change sentiment; otherwise, sellers will continue targeting $620 and potentially lower.

S&P 500 Futures – Trendline Breach + AI Forecast Signals Major C📉 S&P 500 Futures – Trendline Breach + AI Forecast Signals Major Correction
VolanX Risk Engine Flags High Probability Downside
🧠 Narrative:
Markets have enjoyed a powerful uptrend off the March lows, but the structure is showing signs of exhaustion.
The ascending trendline—untouched for over two months—has now been breached.
Fibonacci levels cluster below current price, with critical demand at:
6319.25 (immediate test zone)
6179.25 (0.618 retrace)
5964.75 (macro support / VolanX institutional target)
Meanwhile, VolanX Protocol's predictive engine has shifted to a "Strong Sell" with a projected correction path clearly outlined. The 30-day price forecast (shown in red) leans toward a mean reversion toward 5842.12 by late August.
📊 Institutional Trade Plan (VolanX DSS):
Entry Zone: 6360-6380 (Confirmed breakdown retest)
Target 1: 6179.25
Target 2: 5964.75
Final Target: 5842.12
Invalidation: Close above 6480 (new highs with strength)
🔎 Risk/Reward: 3.4+
📈 Trend Deviation: 7.4%
📉 Bearish Conviction: 84.1%
📌 Key Insights:
Breakdown below trendline confirms shift in control to bears
Institutional models anticipate volatility-led selloff
Major liquidity rests below 6200 and 5960 zones
This is not the time to chase highs—risk is asymmetric
🔮 VolanX Opinion:
“Volatility expansion is near. Institutional capital is likely rotating out of risk. The squeeze has passed; now the trapdoor may open.”
This is where preparation outperforms prediction. Execute with risk logic, not emotion.
📚 #SNP500 #ESFutures #SPX #MacroTrading #SmartMoney #InstitutionalFlow #TrendReversal #Volatility #LiquiditySweep #FibonacciLevels #VolanX #AITrading #EminiFutures #WaverVanir #QuantStrategy #TechnicalAnalysis #Forecast #TradingView

SPY vs VIX two day LongSPY falling wedge - short term oversold - VIX wainning, looks like VIX to retreat to $18.50 area which translates into a DCB on SPY. We'd Aug 6th target = $631/633 Gap fill then probable resumption to the downside to test $613. Good luck 👍

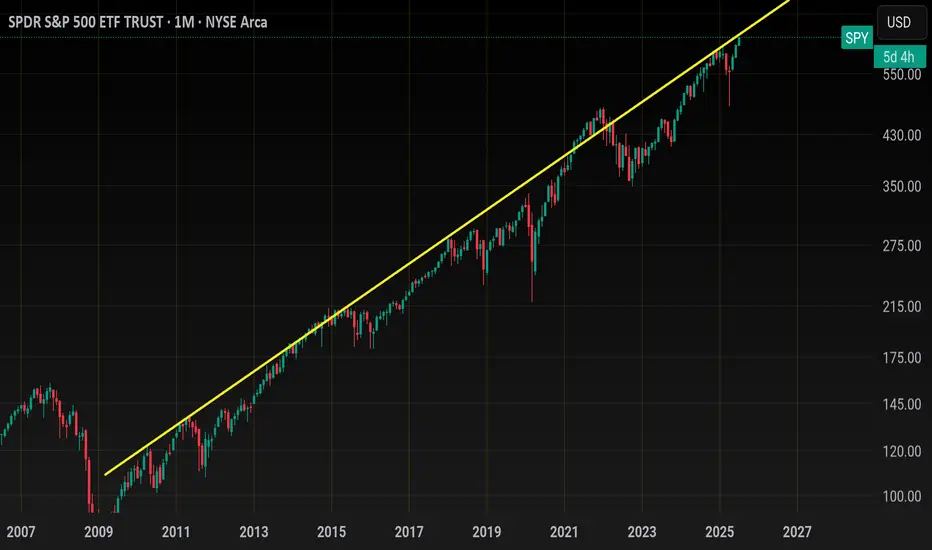
Spy.. 650 topLooking for a top this week
The top of this monthly trendline dating from 2009 should be tagged this week around 643-645.00. As you can see price can grind up here for weeks until the BIG drop.
That grind would possibly be distribution with
A range trade of 620-640 for the month of august. historically Sept is very bearish and could see a drop back below 600 then.
Summer price action looks like so
Smaller price action (Tradeable technicals)
Bull flag early July has us squeezing up this last leg here..
If we gap up Sunday night then i like the short around 638ish
If we gap down and flush i like the dip buy around 634 gap close with the next target being 640+
Daily candle closed outside Bbands so I would not long this on any gap up... on a big earnings week like this, there will be a shake out day or a flush to try and stop out all of those who bought long last week for this weeks earnings.
TVC:NYA or NYSE
Has also reached the top of its weekly channel here. 21,000 will be tough. Price could grind up here but I'd be careful trading anything non tech.
As far as tech goes
Here's NASDAQ:QQQ
monthly chart (Logarithmic)
We have room for 575-580
This should compliment Spy 550
Zoomed in on the daily chart and it's climbing back up to the resistance shown on the monthly
Hourly chart shows price action from early july... tight channel illustrates how frustrating the swings have been
562-563 is support heading into next week. If we have a major gap up Sunday night I would look to open short near 570 for a pullback before ER... if we gap down, I would buy the dip around 563 and average down if need be down to 561..
We should tag 575 this week
The sector that I think lags the most this week is the banking sector... AMEX:XLF
Banks outperform the entire market last week and are overheated at resistance I think they lag this week
I will update this more throughout the week if necessary..
SPY Will Collapse! SELL!
My dear subscribers,
This is my opinion on the SPY next move:
The instrument tests an important psychological level 637.01
Bias - Bearish
Technical Indicators: Supper Trend gives a precise Bearish signal, while Pivot Point HL predicts price changes and potential reversals in the market.
Target - 628.63
About Used Indicators:
On the subsequent day, trading above the pivot point is thought to indicate ongoing bullish sentiment, while trading below the pivot point indicates bearish sentiment.
Disclosure: I am part of Trade Nation's Influencer program and receive a monthly fee for using their TradingView charts in my analysis.
———————————
WISH YOU ALL LUCK
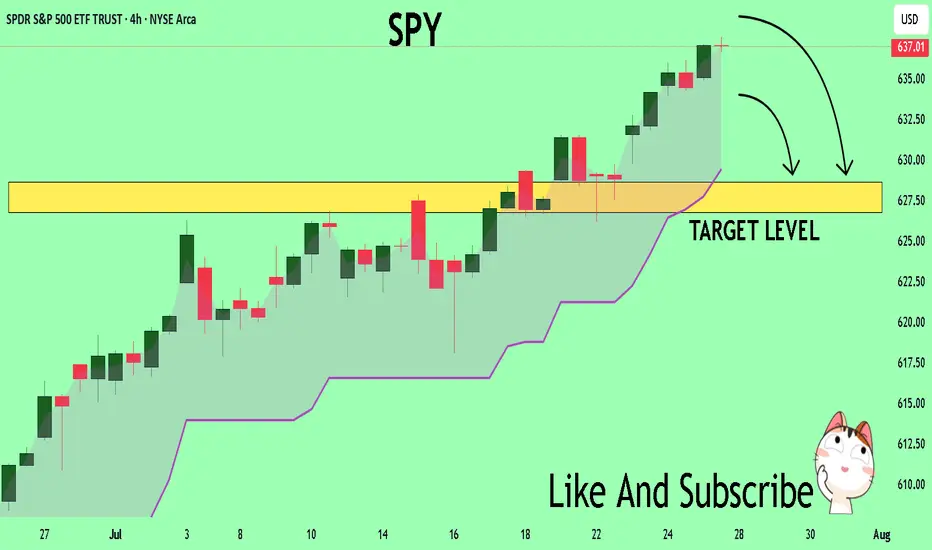
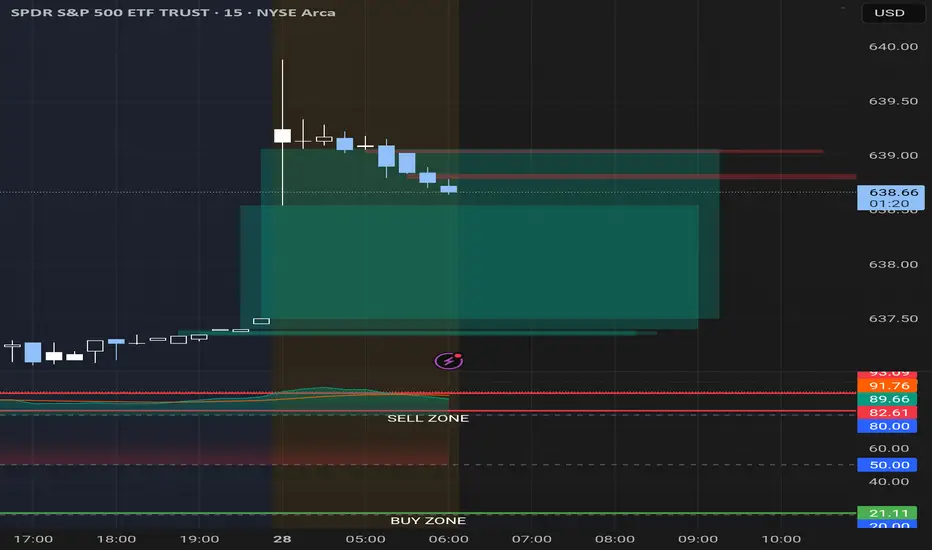
Gapperzville in SPY Both ways“Gappersville” indeed — this SPY 15-minute chart is lit with strategic gaps that are magnetizing price back to equilibrium.
Quick Breakdown:
🔍 Gap Analysis (Intraday Bias)
Two visible unfilled gaps:
First Gap: ~624 to ~627 (partially mitigated)
Second Gap: ~628 to ~630.75 (currently testing EQ of this zone)
Price is now in the Premium Zone (above 0.5 Fibo) from the swing high drop — nearing liquidity sweep territory.
⚙️ Smart Money Concepts (SMC)
Multiple CHoCH and BOS confirm dynamic shifts in structure.
That recent BOS above 627.39 is key — suggesting a short-term bullish microstructure.
Equilibrium at 629.77 is now being tested — price may chop here unless liquidity gets swept above 630.76.
🟦 Discount Zone Support
Deep discount zone lies between 614.06 – 611.96.
This demand zone is still untouched and could act as a high-probability reversion target if the premium structure fails.
🧮 Fibonacci Clusters
Heavy cluster from 630.84 – 633.64 = major confluence + potential rejection/sell zone.
If price gaps up into this zone on low volume, expect short entries from liquidity-based traders.
🔊 Volume Profile
Spike on Aug 2 & 4 suggests buy programs were activated—likely institutional reaction to demand near 620–624.
🔮 Strategic Forecast (as of Aug 4 close)
⚠️ Bearish bias remains intact unless SPY reclaims and closes above 637.57 (weak high).
🎯 Watch for:
Shorts around 633–635 (confluence zone)
Mean reversion into 624.01 or even 619.70
Final demand: 614–612 zone

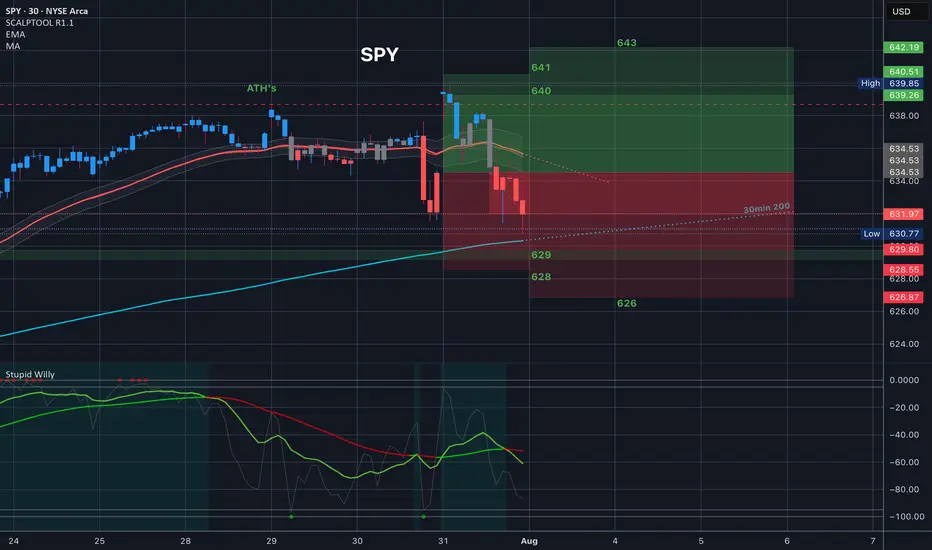
$SPY Analysis, Key Levels & Targets 8.4.25
Today’s Trading Range - we have a great range expansion here from last Friday’s drop. Some interesting targets here. Let me know what you see.
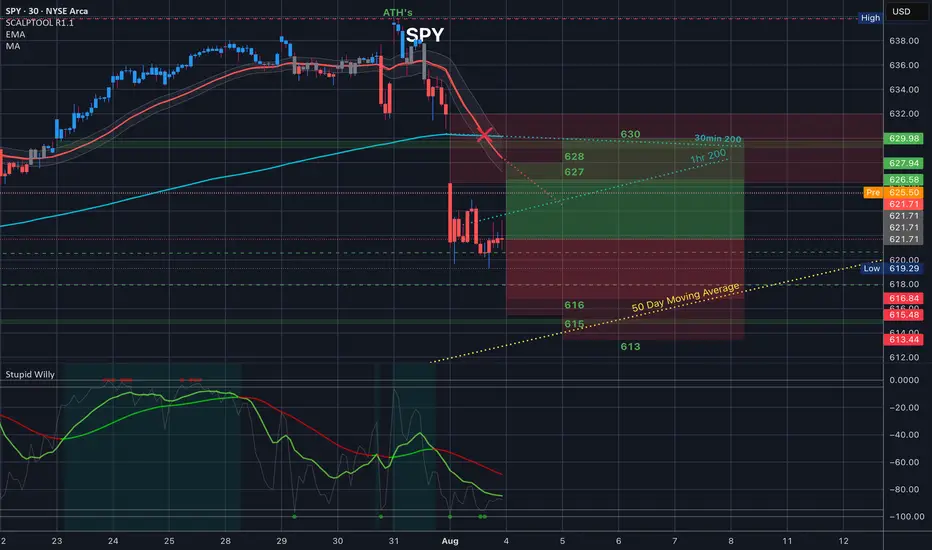
$SPY Analysis, Key Levels & Targets
This is how last night’s members chart played out and it was amazing. We opened at the top of the trading range and all of the spreads at the top paid as we dropped back to the 30in 200MA
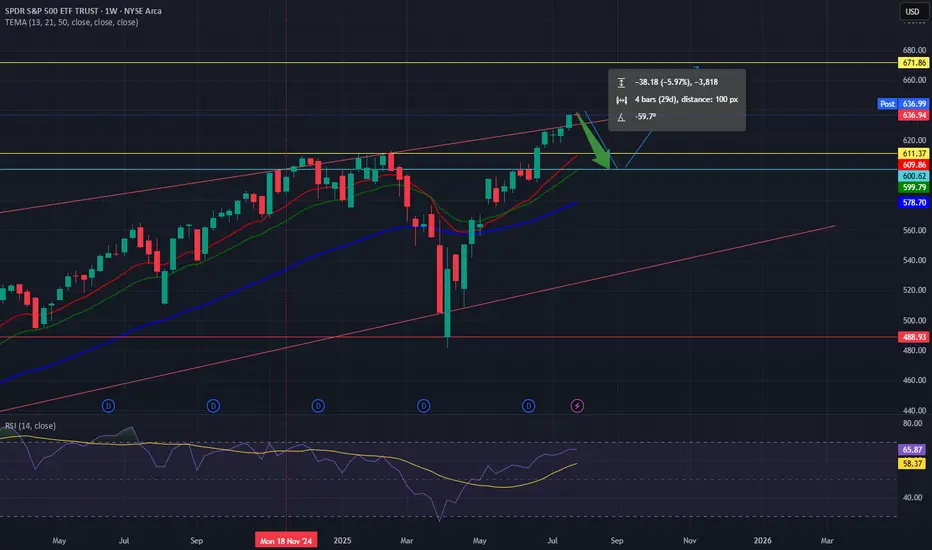
SPY Weekly Chart: Rising Wedge Signals Imminent PullbackSPY Weekly Chart Overview (Current Price: ~637)
🧭 Context:
Indicators: TEMA (13/21/50) & RSI (14)
Price is extended, RSI near overbought (65.87), and forming a rising wedge — a bearish pattern.
🔻 Bearish Setup: Rising wedge signals possible reversal.
Momentum weakening despite higher highs.
Price extended above TEMA — a 600–610 pullback looks likely.
📊 Key Levels:Resistance: 672
Support: 611–600 → 578 → 488
Break below 600 could trigger broad downside.
🟢 Bullish Case:
Breakout above 672 with volume = momentum continuation (AI/FOMO driven).
🎯 Conclusion:
SPY is technically stretched. Risk/reward favors caution.
Watch for pullback to 600–610
A tale of two wedgesIn early 2025 we’ve seen two classic wedge patterns on two of the market’s most watched charts: a falling wedge on the U.S. Dollar Index ( TVC:DXY ) and a rising wedge on the S&P 500 ETF ( AMEX:SPY ). Alone each tells its own tale—but together they sketch a tug‑of‑war between a fading dollar and resilient equities.
The Falling Wedge on DXY
A falling wedge in a downtrend signals waning bearish momentum and often precedes a bullish reversal once price breaks the upper trendline.
The Rising Wedge on SPY
A rising wedge in an uptrend is classically a bearish reversal pattern —a breakdown below the lower trendline confirms sellers are gaining control.
A Converging Reversal
Given the well‑known inverse correlation between the dollar and most assets, it’s noteworthy that both asset classes are flashing signs of a reversal. Taken together that makes a compelling argument.

SPY: Pullback or No? Hey everyone,
Posting again for next week.
My thoughts, not advice as usual.
Hope you find them helpful and I hope you all have a great and sunny weekend!
Take care and safe trades!

Nightly $SPY / $SPX Scenarios for July 29, 2025🔮 Nightly AMEX:SPY / SP:SPX Scenarios for July 29, 2025 🔮
🌍 Market‑Moving News 🌍
U.S.–EU Trade Deal Sparks Optimism
The U.S. and EU signed a trade framework allowing a 15% tariff rate on most EU imports, averting harsher penalties. The S&P 500 and Nasdaq both closed at fresh record highs, supported by upbeat tech earnings sentiment—Tesla advanced on a new $16.5B AI chip deal with Samsung—while U.S.–China trade talks resume in Stockholm.
Fed Likely to Hold Rates; Political Pressure Mounts
The Fed is expected to leave its benchmark rate at 4.25%–4.50% at the July 29–30 FOMC meeting. Chair Powell faces growing political pressure from President Trump to cut rates and concerns about central bank independence remain elevated.
Trade Talks Extension to Avoid Tariff Hike Deadline
The August 1 tariff deadline looms. Markets are watching to see if trade deals with China, Canada, and the EU extend the pause or risk new tariffs. Volume in AI/chip stocks and industrials reflects sensitivity to trade developments.
📊 Key Data Releases & Events 📊
📅 Tuesday, July 29
FOMC Meeting Begins — All eyes on Fed rate decision and updated projections.
GDP (Advance Q2 Estimate) — Expected around +1.9% on signs of economic rebound.
⚠️ Disclaimer:
This summary is for educational and informational purposes only—it is not financial advice. Always consult a licensed financial advisor before making investment decisions.
📌 #trading #stockmarket #economy #Fed #trade #tariffs #PCE #jobs #technicalanalysis

Trading as a Probabilistic ProcessTrading as a Probabilistic Process
As mentioned in the previous post , involvement in the market occurs for a wide range of reasons, which creates structural disorder. As a result, trading must be approached with the understanding that outcomes are variable. While a setup may reach a predefined target, it may also result in partial continuation, overextension, no follow-through, or immediate reversal. We trade based on known variables and informed expectations, but the outcome may still fall outside them.
Therefore each individual trade should be viewed as a random outcome. A valid setup could lose; an invalid one could win. It is possible to follow every rule and still take a loss. It is equally possible to break all rules and still see profits. These inconsistencies can cluster into streaks, several wins or losses in a row, without indicating anything about the applied system.
To navigate this, traders should think in terms of sample size. A single trade provides limited insight, relevant information only emerges over a sequence of outcomes. Probabilistic trading means acting on repeatable conditions that show positive expectancy over time, while accepting that the result of any individual trade is unknowable.
Expected Value
Expected value is a formula to measure the long-term performance of a trading system. It represents the average outcome per trade over time, factoring in both wins and losses:
Expected Value = (Win Rate × Average Win) – (Loss Rate × Average Loss)
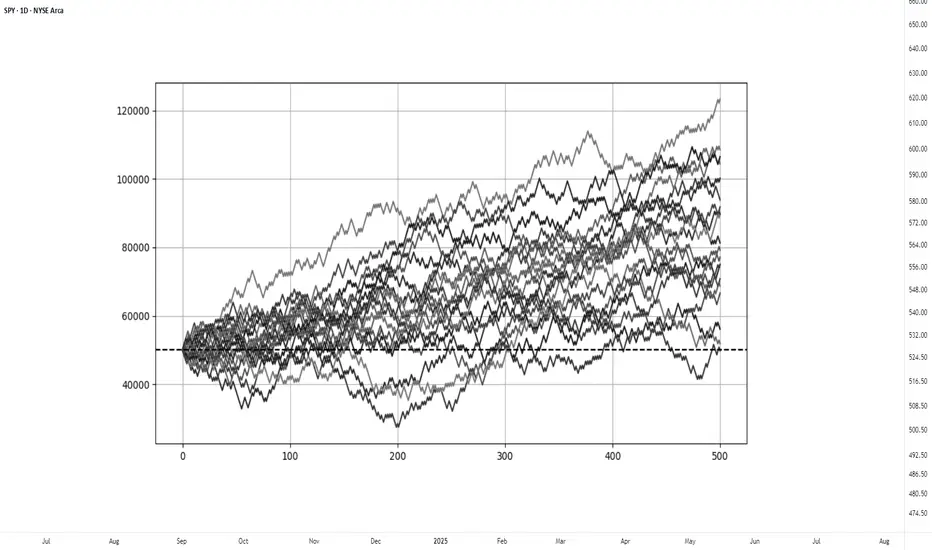
This principle can be demonstrated through simulation. A basic system with a 50% win rate and a 1.1 to 1 reward-to-risk ratio was tested over 500 trades across 20 independent runs. Each run began with a $50,000 account and applied a fixed risk of $1000 per trade. The setup, rules, and parameters remained identical throughout; the only difference was the random sequence in which wins and losses occurred.
While most runs clustered around a profitable outcome consistent with the positive expected value, several outliers demonstrated the impact of sequencing. When 250 trades had been done, one account was up more than 60% while another was down nearly 40%. In one run, the account more than doubled by the end of the 500 trades. In another, it failed to generate any meaningful profit across the entire sequence. These differences occurred not because of flaws in the system, but because of randomness in the order of outcomes.
These are known as Monte Carlo simulations, a method used to estimate possible outcomes of a system by repeatedly running it through randomized sequences. The technique is applied in many fields to model uncertainty and variation. In trading, it can be used to observe how a strategy performs across different sequences of wins and losses, helping to understand the range of outcomes that may result from probability.
Trading System Variations
Two different strategies can produce the same expected value, even if they operate on different terms. This is not a theoretical point, but a practical one that influences what kind of outcomes can be expected.
For example, System A operates with a high win rate and a lower reward-to-risk ratio. It wins 70% of the time with a 0.5 R, while System B takes the opposite approach and wins 30% of the time with a 2.5 R. If the applied risk is $1,000, the following results appear:
System A = (0.70 × 500) − (0.30 × 1,000) = 350 − 300 = $50
System B = (0.30 × 2,500) − (0.70 × 1,000) = 750 − 700 = $50
Both systems average a profit of $50 per trade, yet they are very different to trade and experience. Both are valid approaches if applied consistently. What matters is not the math alone, but whether the method can be executed consistently across the full range of outcomes.
Let’s look a bit closer into the simulations and practical implications.
The simulation above shows the higher winrate, lower reward system with an initial $100,000 balance, which made 50 independent runs of 1000 trades each. It produced an average final balance of $134,225. In terms of variance, the lowest final balance reached $99,500 while the best performer $164,000. Drawdowns remained modest, with an average of 7.67%, and only 5% of the runs ended below the initial $100,000 balance. This approach delivers more frequent rewards and a smoother equity curve, but requires strict control in terms of loss size.
The simulation above shows the lower winrate, higher reward system with an initial $100,000 balance, which made 50 independent runs of 1000 trades each. It produced an average final balance of $132,175. The variance was wider, where some run ended near $86,500 and another moved past $175,000. The drawdowns were deeper and more volatile, with an average of 21%, with the worst at 45%. This approach encounters more frequent losses but has infrequent winners that provide the performance required. This approach requires patience and mental resilience to handle frequent losses.
Practical Implications and Risk
While these simulations are static and simplified compared to real-world trading, the principle remains applicable. These results reinforce the idea that trading outcomes must be viewed probabilistically. A reasonable system can produce a wide range of results in the short term. Without sufficient sample size and risk control, even a valid approach may fail to perform. The purpose is not to predict the outcome of one trade, but to manage risk in a way that allows the account to endure variance and let statistical edge develop over time.
This randomness cannot be eliminated, but the impact can be controlled from position sizing. In case the size is too large, even a profitable system can be wiped out during an unfavorable sequence. This consideration is critical to survive long enough for the edge to express itself.
This is also the reason to remain detached from individual trades. When a trade is invalidated or risk has been exceeded, it should be treated as complete. Each outcome is part of a larger sample. Performance can only be evaluated through cumulative data, not individual trades.
Are you ready for this scenario?? BUY THE NEXT BOTTOM!!!Spx is gonna drop hard, are you ready to buy the next bottom?
I expect SPX to reach 4,440 atleast... NASDAQ, BITCOIN are gonna drop hard too...
BUY EVERYTHING IN 2026/2027 AND ENJOY THE NEXT CYCLE.

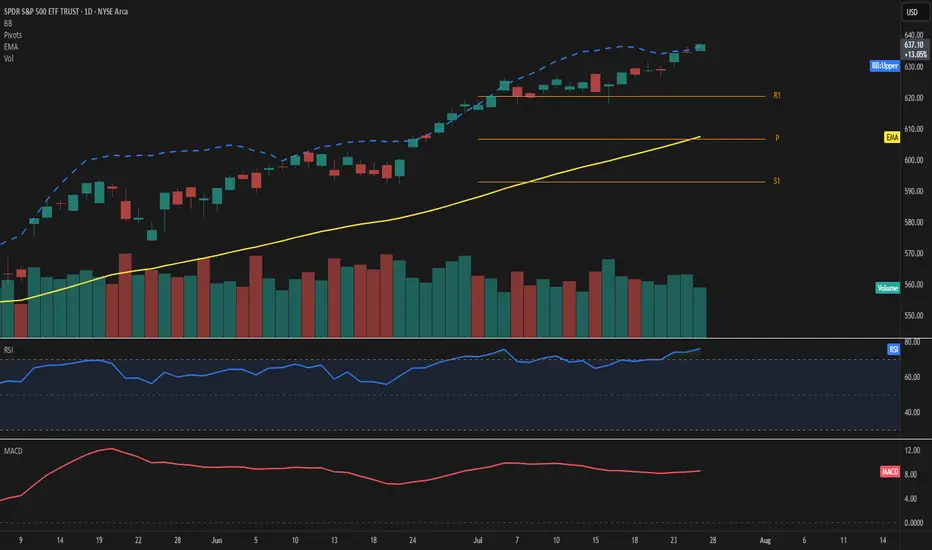
SPY – Explosive strength above resistancePrice extends well above the 50-day EMA and pierces through the upper Bollinger Band, highlighting strong bullish momentum. RSI stands at 76, confirming overbought conditions, while MACD remains firmly positive.
The ongoing move leaves the EMA50 at 608 and the Fibonacci pivot at 607—both now acting as key support levels. With R1 at 620 already surpassed, the next potential resistance zone lies in uncharted territory beyond 636.
Volume has decreased by over 20%, which tempers the move slightly and should be monitored closely.
As long as price holds above 620, the bullish scenario remains valid.
Watch for any sudden spike in volume or a drop back below 636 as a possible shift signal.
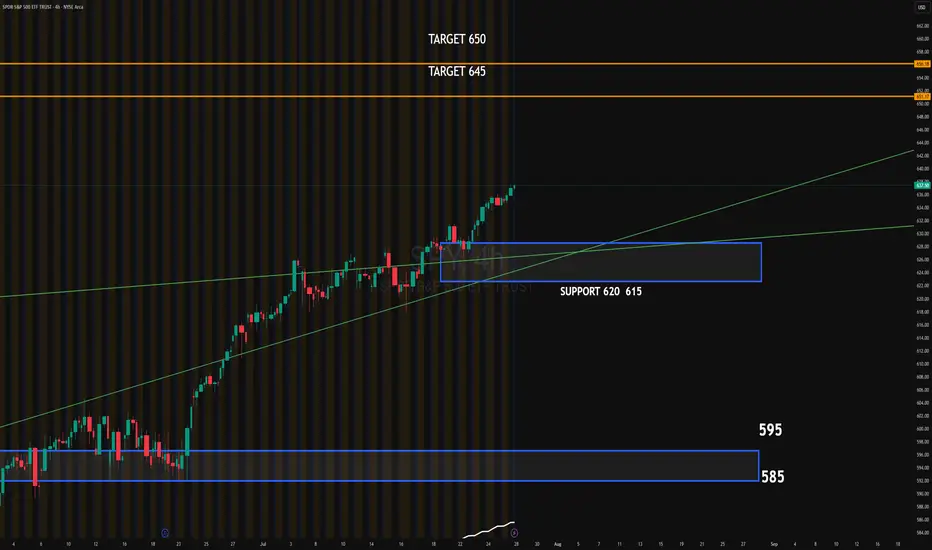
SPY 4HSSPY continues its bullish trend after breaking above the ascending channel. The recent breakout shows strong momentum, supported by institutional absorption around the 620–615 zone. This area now acts as key support.
Upside target: 645
Extended target: 650
Downside target if momentum fails: 620–615 zone, followed by 595
#SPY #globaltrade #investment #investing #stockmarket #wealth #realestate #markets #economy #finance #money #forex #trading #price #business #currency #blockchain #crypto #cryptocurrency #airdrop #btc #ethereum #ico #altcoin #cryptonews #Bitcoin #ipo
Stock Market Forecast | TSLA NVDA AAPL AMZN META MSFTStock Market Forecast | CME_MINI:NQ1! CME_MINI:ES1! SPY QQQ
Mag 7 forecast NASDAQ:TSLA NASDAQ:NVDA AAPL AMZN META MSFT GOOG

SPY 15-Min — Weak-High Sweep in Play• Discount BOS at 603.95 → impulsive leg to 606.7 (0.886)
• Weak high tagged at 607.16 – expecting continuation to 1.382 ≈ 608.61 then 1.854 ≈ 610.92
• Invalidation if price closes below 605.45 session VWAP band
• Targets: 608.61 → 610.92
• Risk: stop 604.9 (below 0.5 Fib)
VolanX bias remains risk-on while micro structure stair-steps above the 9-EMA channel.
Educational only – not financial advice
#SPY #SMP500 #OrderFlow #Fib #VolanX #WaverVanir

Play I am looking at.Golden cross starting to line up on VVIX on the 10 and 15min. If VIX spikes we could fill the Gap on SPY making it a perfect set up as it will also lign it up for a rebound off the 200MA. Depending on what the level 2 says at that time ill be loading 640 calls and 643Calls. I'll take a speculative guess that it SPY will open with short formed W pattern off that MA.
Weekly $SPY / $SPX Scenarios for July 28–August 1, 2025🔮 Weekly AMEX:SPY / SP:SPX Scenarios for July 28–August 1, 2025 🔮
🌍 Market‑Moving News 🌍
🏦 Fed Holds Steady, Faces Political Pressure
The Federal Reserve is expected to keep rates at 4.25%–4.50% during its FOMC meeting midweek. While rates are unchanged, political pressure from President Trump continues as calls intensify for rate cuts and questions arise over the Fed’s independence—including dissent from Governors Waller and Bowman.
📦 Trade Truce Extends & New Deal With EU
A new trade framework with the EU reduces tariffs to 15%, easing tensions. Meanwhile, U.S. and Chinese trade teams begin talks in Stockholm on Monday aiming to avoid an early-August tariff deadline.
💻 Tech and Mega-Cap Earnings Spotlight
This week features earnings from tech giants including Meta, Microsoft (Wednesday), followed by Amazon and Apple (Thursday). Markets will prioritize forward guidance around AI investments, capital expenditures, and sales trends.
📊 Key Data Releases & Events 📊
📅 Monday, July 28
No major releases
📅 Tuesday, July 29
Chicago PMI (July flash) – early indicator of regional manufacturing trends.
Global PMIs – flash readings for Europe and Asia gauge economic health.
📅 Wednesday, July 30
FOMC Rate Decision & Powell Press Conference – investors will scrutinize tone, forward guidance on rates, labor markets, and inflation.
Q2 U.S. GDP (Advance Estimate) – expected at ~1.9%, signaling rebound after Q1 contraction.
📅 Thursday, July 31
June PCE & Core PCE Indexes – Fed’s preferred inflation measure. Core PCE expected at ~2.7% YoY.
Consumer Confidence (July) – key for household spending trends.
Trade Balance (June) – provides data on U.S. import/export dynamics.
📅 Friday, August 1
July Nonfarm Payrolls, Unemployment & Wage Data – forecast for ~102,000 new jobs and ~4.2% unemployment; markets await for labor-market cooling signs.
Tariff Deadline – new tariffs loom unless trade agreements with EU, Canada, China etc. materialize by today’s cutoff.
⚠️ Disclaimer:
This summary is educational and informational only. It is not financial advice. Always consult a licensed financial advisor before making any investment decisions.
📌 #trading #stockmarket #economy #Fed #earnings #inflation #tariffs #GDP #PCE #jobs #technicalanalysis
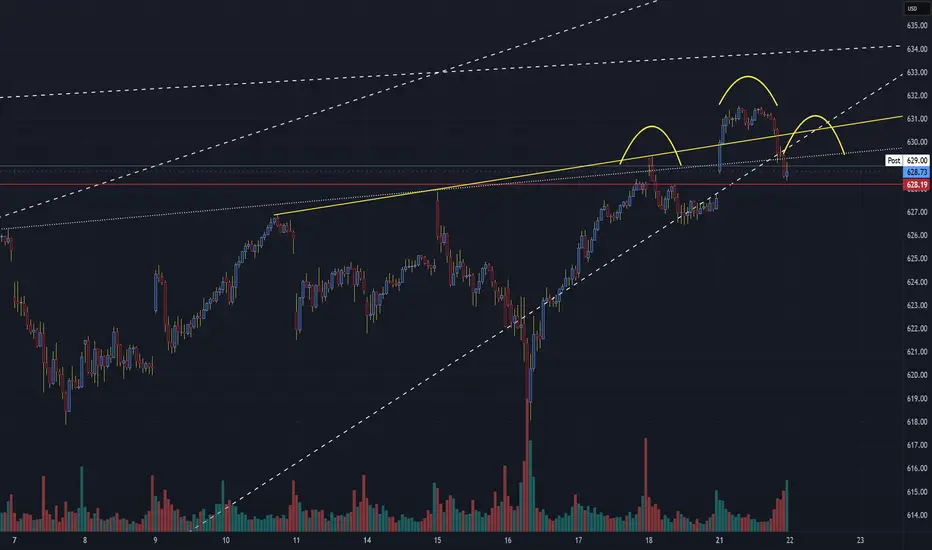
SPY Forming A Bearish Head and Shoulders PatternSPX Technical Update – Bearish Watch
Chart Focus: S&P 500 Index (30-Min Chart)
Date: July 21, 2025
🧠 Pattern Watch: Classic Head & Shoulders Formation
A clear head and shoulders pattern has emerged on the short-term 30-minute chart, signaling a potential bearish reversal after the recent uptrend.
Left Shoulder: Around 630.75
Head: Peaked near 633.00
Right Shoulder: Capped just under 631.00
Neckline: Sits near the 628.75–628.20 zone, marked by a yellow upward-sloping trendline and tested support.
📉 Bearish Breakdown in Play
The price has now broken below the neckline zone at 628.75 with increasing volume — an early confirmation of a bearish break.
The break beneath the rising wedge support and neckline suggests increased downside risk in the near term.
🧭 Technical Levels to Watch
Key Level Type Action
633.00 Resistance (Head) Likely capped unless strong reversal
631.00 Resistance Right shoulder, overhead rejection
628.75 Neckline Support (Broken) Bearish trigger zone
628.20 Intraday support Final support test (now resistance)
625.50 Initial Target Breakdown projection
622.75 Lower Support Measured move target zone
📌 Measured Move Projection:
A break of ~4.5 points from head to neckline projects a target near 624–625 in the near term.
📊 Volume Profile Note
Volume expanded on the neckline break, supporting the validity of the pattern.
Recent bars show a rise in selling pressure as bulls failed to reclaim above 630 after the breakdown.
🔍 Summary Outlook
Bearish Bias: Valid while below 628.75 neckline resistance.
Invalidation Zone: A sustained close above 631.00 would invalidate the bearish pattern.
Watch for Retest: Any bounce into 628.75–629.25 could act as a retest and fade opportunity.
📆 Next Steps:
Short-term traders should monitor price action around 625.50 and 622.75 as the most likely zones for support. Watch for further confirmation with broader index weakness or macro catalysts.