SPY CONTINUES IN AN ASCENDING WEDGE PATTERNThe SPDR S&P 500 ETF Trust (SPY) is currently exhibiting an ascending wedge pattern on the 30-minute chart, a bearish technical pattern that often signals a potential reversal or selloff when confirmed. Below, I’ll explain the ascending wedge pattern, identify key levels to watch for a potential selloff, and provide context based on recent market sentiment. Since I cannot view the real-time chart, I’ll base the analysis on the characteristics of an ascending wedge and recent posts on X that discuss SPY’s price action, ensuring a critical approach to the data.
What is an Ascending Wedge Pattern?
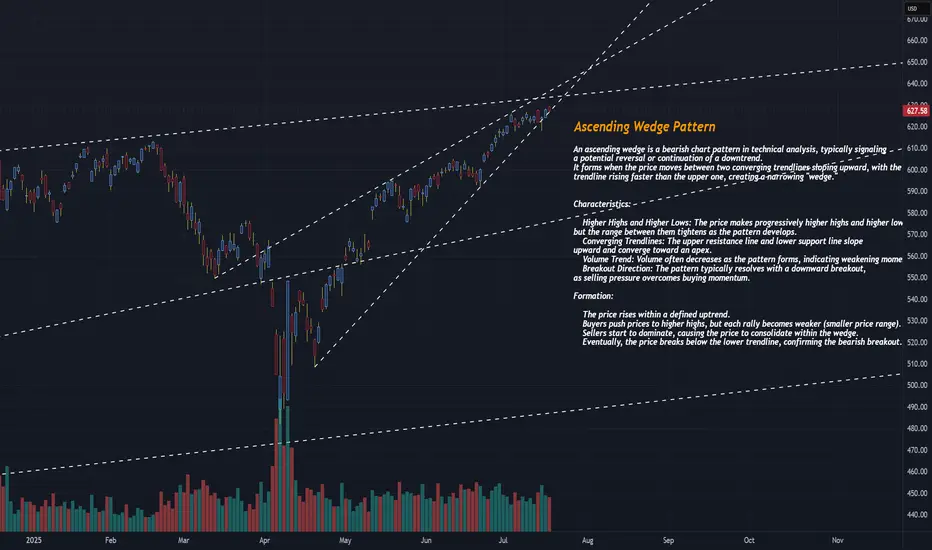
An ascending wedge (or rising wedge) is a bearish chart pattern formed when the price consolidates between two upward-sloping trendlines that converge over time. The upper trendline (resistance) connects higher highs, and the lower trendline (support) connects higher lows, creating a narrowing price range. This pattern typically indicates that bullish momentum is weakening, as buyers are pushing prices higher but with diminishing strength, often leading to a breakdown below the lower trendline.
Key characteristics of an ascending wedge include:
Converging Trendlines: Both the support and resistance lines slope upward, with the support line often steeper than the resistance line.
Decreasing Volume: Trading volume typically declines as the pattern forms, reflecting reduced buying conviction. A spike in volume often accompanies a breakout or breakdown.
Bearish Implication: In an uptrend, the ascending wedge signals a potential reversal to the downside. In a downtrend, it may act as a continuation pattern, but the bearish bias remains.
Breakout Confirmation: A convincing break below the lower trendline, preferably with increased volume, confirms the bearish reversal. A retest of the broken support (now resistance) may occur before further declines.
The pattern typically forms over 3–4 weeks but can appear on shorter timeframes like the 30-minute chart, making it relevant for intraday or short-term traders.investopedia.comen.wikipedia.org
SPY’s Current Ascending Wedge on the 30-Minute Chart
Given that SPY is in an ascending wedge on the 30-minute chart, we can infer the following based on recent posts on X and general technical analysis principles:
Pattern Context:
The ascending wedge suggests SPY has been making higher highs and higher lows in a tightening range, indicating a potential exhaustion of the bullish trend.
Recent posts on X (e.g., @AskPerplexity on July 16, 2025) noted a rising wedge in SPY with a breakdown through the lower trendline, suggesting bearish momentum. Another post (@YakshuMadaan on July 15, 2025) mentioned a wedge breaking below 6220, targeting 6050 on the S&P 500 index ( SP:SPX ), which correlates to SPY levels around $605–$610.
Key Levels to Watch:
Lower Trendline (Support): The critical level to monitor is the lower trendline of the wedge, which connects the higher lows. A decisive break below this level (e.g., a close below on the 30-minute chart with strong volume) signals a bearish breakdown and potential selloff. Based on recent X posts, this level may have been around $622 (equivalent to ~6220 on SP:SPX ) recently, but you should confirm the exact level on the current chart.
Upper Trendline (Resistance): The upper trendline connects the higher highs and acts as resistance. If SPY fails to break above this level, it reinforces the bearish bias. This could be near recent highs, potentially around $630–$635, depending on the chart’s progression.
Support Zones Post-Breakdown: If the lower trendline breaks, key support levels to watch include:
$590–$600: A post on X highlighted this as a major support zone based on volume profile analysis, likely corresponding to a prior consolidation area or gap fill.
$605–$610: Another post suggested a target of 6050 on SP:SPX , translating to roughly $605–$610 for SPY, aligning with a significant retracement level.
Retest Level: After a breakdown, the price may retest the broken lower trendline (now resistance). For example, if the breakdown occurs at $622, a retest could see SPY rally back to $622–$625 before resuming the decline.ig.com
Volume and Indicators:
Volume: Look for declining volume as the wedge forms, followed by a spike on the breakdown to confirm the move. Low volume during the wedge suggests waning bullish momentum.xs.com
Relative Strength Index (RSI): An RSI above 70 near the upper trendline or showing bearish divergence (lower RSI highs while price makes higher highs) strengthens the case for a selloff.xs.com
Moving Average Convergence Divergence (MACD): A bearish crossover (MACD line crossing below the signal line) near the upper trendline can confirm weakening momentum.xs.com
Potential Selloff Triggers:
A close below the lower trendline on the 30-minute chart, especially with a spike in volume, is the primary trigger for a selloff. For example, a break below $622 (if that’s the current support) could initiate a move toward $605–$610 or lower to $590–$600.
A failed retest of the broken trendline (e.g., SPY rallies to $622–$625 after breaking down but fails to reclaim the trendline) would confirm bearish continuation.
Broader Market Context: Recent X posts suggest market concerns about macroeconomic factors (e.g., interest rate fears, policy shifts) could amplify a selloff, especially if technical levels break.
SPY trade ideas
SPY Imagine the SmellImagine the smell from the Bulls if the $514 gap is filled.
Bearish divergence galore.
Not a matter of if this wedge breaks.
Its when.
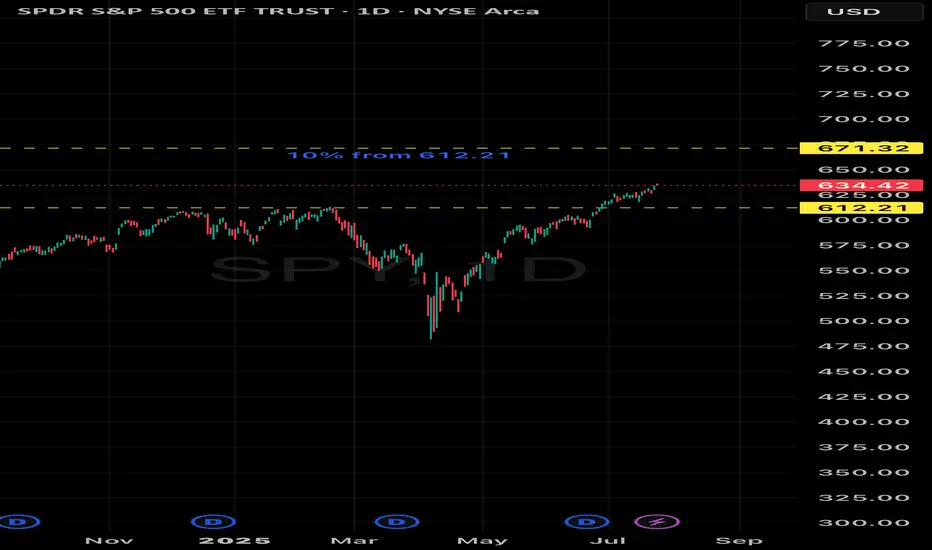
Spy ATH prediction by end of 2025 10% from 613 triple top ATH major major level. I think SPY see 672 before 2025 is over 🔮
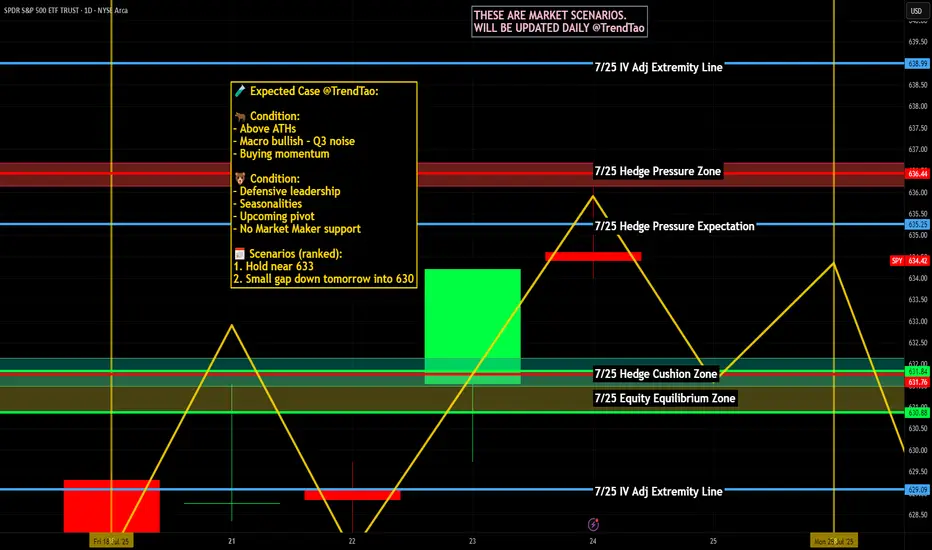
Nightly $SPY / $SPX Scenarios for July 25, 2025🔮 Nightly AMEX:SPY / CBOE:SPX Scenarios for July 25, 2025 🔮
🌍 Market‑Moving News 🌍
🏔️ Copper Market Flashpoint
Following President Trump’s announcement of steep copper tariffs (15–50% range), U.S. copper futures surged, then sharply reversed. Inventory arbitrage between CME and LME markets surged, distorting pricing dynamics and triggering concern over metal market stability.
🇪🇺 EU–China Summit Signals Trade Reset
EU leaders concluded their 25th summit with China, fostering deeper economic and strategic ties. Observers expect follow-up on mutual trade agreements, particularly regarding tech and sustainability sectors.
🌍 EM Equity Rally Consolidates Gains
Emerging markets continue to outperform global equities in 2025—with MSCI EM up ~18% vs. S&P 500. Analysts highlight strong opportunities in AI/fintech stocks in China and Latin America, suggesting further rotations out of U.S. markets.
📊 Key Data Releases & Events 📊
📅 Friday, July 25:
8:30 AM ET – Durable Goods Orders (June):
Forecast shows a sharp drop (~–10%), following a ~16% gain in May—signaling possible cooling in business-related equipment purchases.
10:00 AM ET – U.S. Imports of Steel Products (June):
Trade-data release monitoring steel flows amid evolving tariff frameworks.
All Day – Corporate Earnings Reports:
Companies such as First Financial Bancorp (FFBC), HCA, AON, Charter, and others report earnings. Outlooks may influence small- to mid-cap sentiment.
⚠️ Disclaimer:
This report is for educational and informational purposes only—not financial advice. Always consult a licensed financial advisor before making investment decisions.
📌 #trading #stockmarket #economy #data #earnings #commodities #EM #technicalanalysis
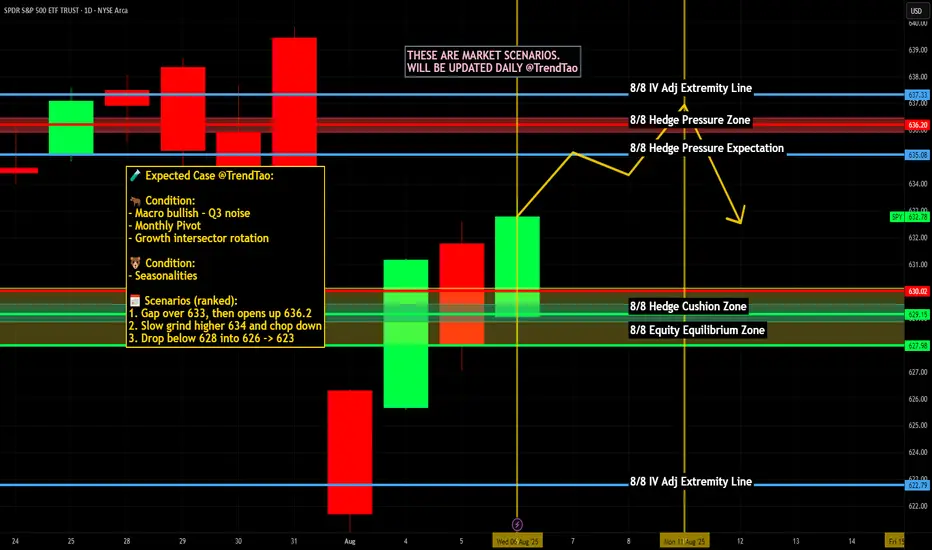
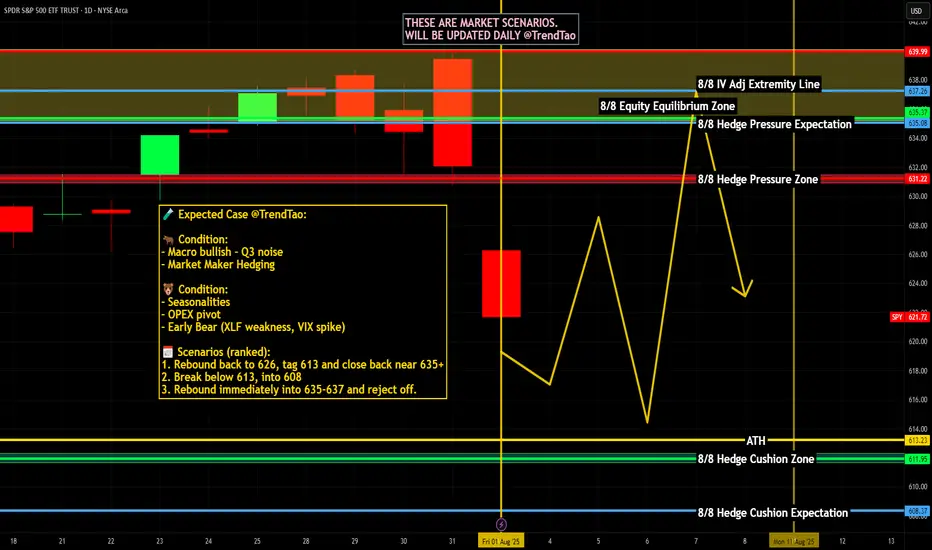
Nightly $SPY / $SPX Scenarios for August 7, 2025🔮 Nightly AMEX:SPY / SP:SPX Scenarios for August 7, 2025 🔮
🌍 Market‑Moving News 🌍
📦 Major Tariffs Implemented Today
Sweeping tariffs ranging from 10% to over 40% officially took effect today on imports from numerous countries, significantly escalating global trade tensions. Markets are closely tracking initial reactions across affected sectors, especially pharmaceuticals and semiconductors.
💻 Semiconductor Tariff Shakes Tech Sector
President Trump introduced a substantial 100% tariff on semiconductor imports, with notable exemptions for U.S. investors such as Apple, Nvidia, and AMD. Apple shares surged 5.1% amid investor optimism, while broader tech stocks saw mixed reactions.
🚀 Firefly Aerospace IPO Debut
Firefly Aerospace launched its IPO today, pricing shares at $45. The stock began trading on Nasdaq under ticker "FLY," attracting significant attention due to its positioning in the space and defense technology sector.
📊 Key Data Releases & Events 📊
📅 Thursday, August 7, 2025:
8:30 AM ET – Initial Jobless Claims (week ending Aug 2)
Forecast: 221,000
Previous: 218,000
8:30 AM ET – U.S. Productivity (Q2)
Forecast: 1.9%
Previous: –1.5%
8:30 AM ET – U.S. Unit Labor Costs (Q2)
Forecast: 1.3%
Previous: 6.6%
10:00 AM ET – Wholesale Inventories (June)
Forecast: N/A
Previous: –0.3%
10:00 AM ET – Speech by Atlanta Fed President Raphael Bostic
Topic: Monetary policy outlook; market-sensitive for potential Fed signals.
3:00 PM ET – Consumer Credit (June)
Forecast: N/A
Previous: $5.1B
⚠️ Disclaimer:
This content is for educational and informational use only and is not financial advice. Always consult a licensed financial advisor before making investment decisions.
📌 #trading #stockmarket #economy #tech #earnings #IPO #Fed #tariffs #semiconductors
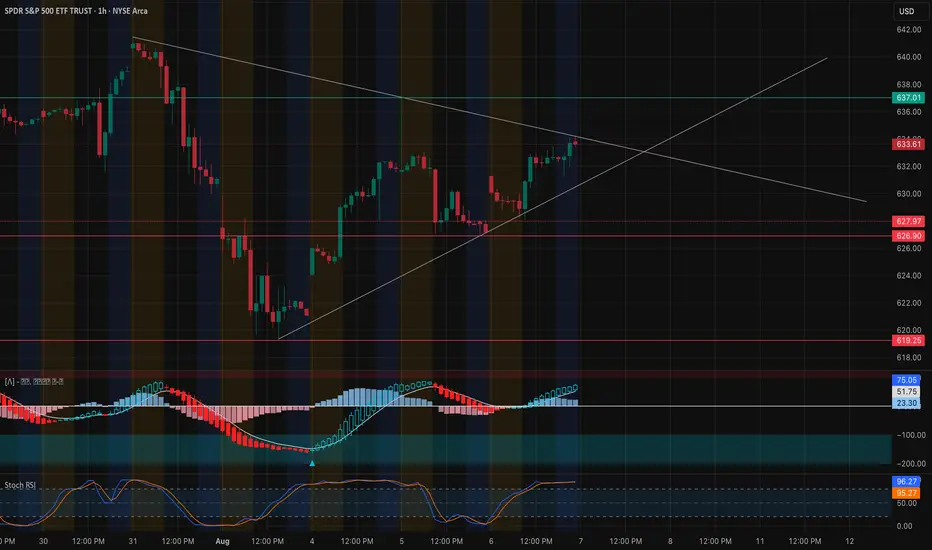
SPY Approaching Apex — Breakout or Trap Ahead? Aug 7SPY Approaching Apex — Breakout or Trap Ahead? 🔥
📊 Technical Analysis (1H Chart)
SPY has reclaimed the rising wedge support trendline and is now grinding just beneath a confluence of resistance near 633.61. This is the third test of this breakout zone, forming a squeeze triangle with lower highs and higher lows.
Key Structure Notes:
* Bullish momentum continues to build on the MACD histogram with rising blue bars and a bullish cross already established.
* Stoch RSI is extremely overbought (96+), which suggests caution — SPY is vulnerable to rejection if buyers lose steam.
* Price action remains orderly and within trendline compression. A breakout above 634 could unleash aggressive buying, while losing 631 opens the door to retest 627–628 demand.
Intraday Levels to Watch:
* 📈 Resistance: 633.61 → 634.20 → 637.00 (key horizontal resistance and fib extension)
* 📉 Support: 631.00 → 628.20 → 626.90 → 619.25
🔍 Options GEX & Dealer Positioning
The GEX board favors bullish continuation — but also hints at gamma traps near the top:
* 🟢 634.00–634.20: 91.11% GEX concentration at 2nd CALL Wall — this is the biggest dealer hedge wall; could act as resistance or gamma squeeze fuel if broken.
* 🟢 637.00: Highest positive net GEX → if SPY pushes above 634 and holds, momentum could carry toward 637.
* 🔴 626.00–625.00: Layered PUT walls and HVL zone provide strong downside cushion.
* 🧭 Net GEX is moderately positive, suggesting dealer flows will slow upside moves unless a sharp squeeze kicks in. Watch IVR (15.3) — low enough to allow scalps but not favorable for selling premium.
🧠 Game Plan & Thoughts
* 🔓 Bullish Scenario: Break and hold above 634 confirms the triangle breakout → target 637–638 next.
* 🛑 Bearish Rejection: Failure at 633.61 or loss of 631 reopens path back to 628.20–626.90 zone.
* 🎯 Suggested Setup: Long scalp above 634 → TP: 637 | SL: 631.
Short setup below 631 → TP: 627 | SL: 634.
Momentum is on the bulls' side for now, but you're buying into a potentially crowded breakout zone. Watch volume and reaction around 634 — breakout or fade will decide next leg.
This analysis is for educational purposes only and does not constitute financial advice. Always manage your risk.
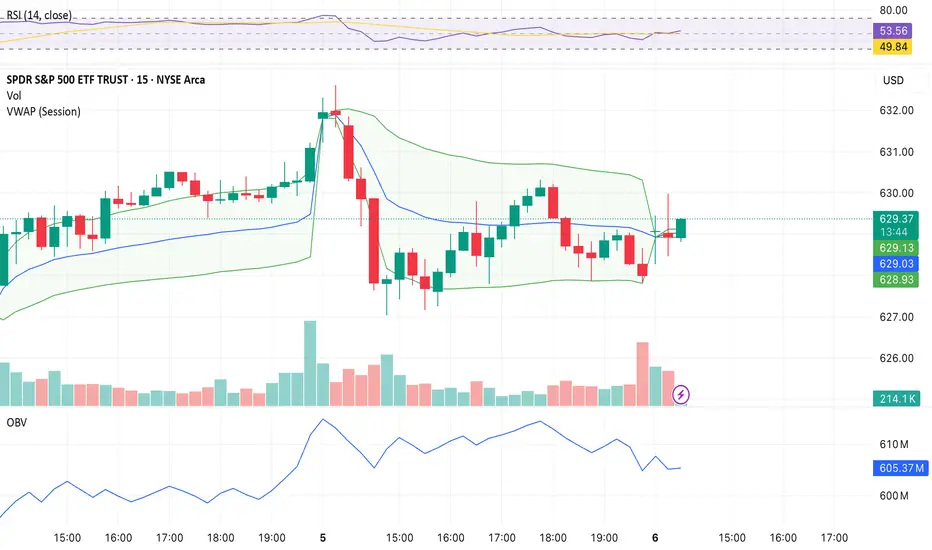
Options Trading for SPY - Bear Spread Oct 17I'm setting up a Bear Put Spread on AMEX:SPY with the following legs:
Buy 630 Put
Sell 620 Put
Expiration: October 18, 2025
Thesis: I'm expecting a bearish move or neutral-to-bearish consolidation over the coming weeks, likely driven by macroeconomic pressure and technical weakness around the 630 level.
Current Price: ~$629.50
Risk/Reward: Defined risk strategy with a maximum loss equal to the net debit paid.
Breakeven Point: $630 – net debit
Max Profit: If SPY closes below $620 at expiration
Max Loss: If SPY closes above $630 at expiration
Technical indicators include:
Price rejection around VWAP
Decreasing OBV during consolidation
RSI divergence suggesting weakening momentum
Watching for further confirmation on breakdown from current levels. Will monitor volume and macro news.
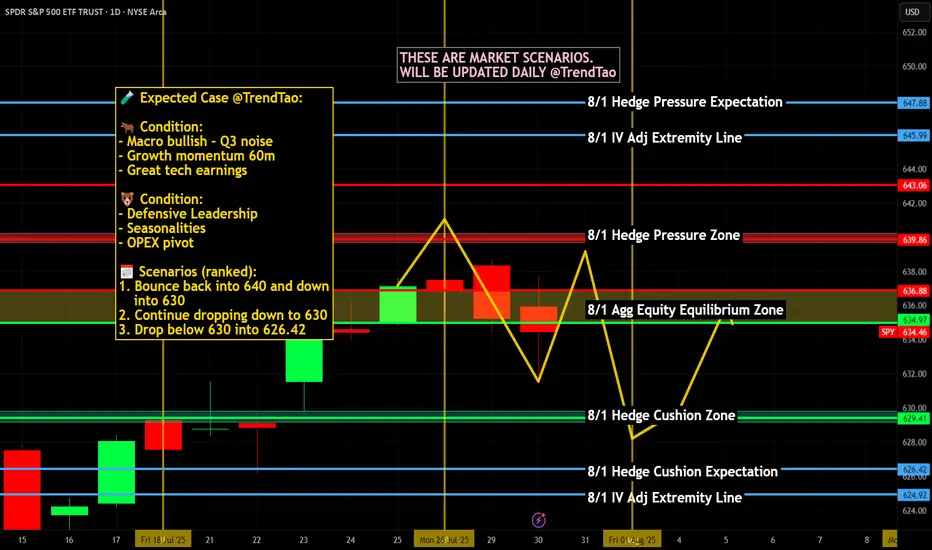
Weekly $SPY / $SPX Scenarios for August 4–8, 2025🔮 Weekly AMEX:SPY / SP:SPX Scenarios for August 4–8, 2025 🔮
🌍 Market-Moving News 🌍
📦 U.S. Tariffs Finalized as August 7 Deadline Nears
President Trump’s administration confirmed newly finalized tariff rates—ranging from 10% to over 40%—on dozens of countries, set to take effect starting August 7. The announcement has heightened global trade uncertainty and injected volatility into equity markets
📉 Weak Jobs Data Spurs Concern
July’s nonfarm payrolls came in at just 73,000 jobs added, far below expectations, while revisions to May and June data subtracted a combined 258,000 jobs. In response, the administration fired the Bureau of Labor Statistics head, escalating political risk around economic transparency
📈 U.S. Shows Resilience Amid Policy Chaos
Despite the tariff-era turbulence and labor softness, U.S. Q2 GDP rose by 3%—outperforming forecasts. Businesses racked up inventory as a hedge, absorbing initial price shocks. Still, concerns about sustained inflation pressures and waning consumer confidence linger
🎯 Earnings Week Spotlight on Tech & Industrial Names
Major companies reporting include Palantir (Monday), AMD, Uber, Disney, McDonald’s, Gilead, Pfizer, Constellation Energy, and Eli Lilly. Markets will watch for AI signals, consumer demand, and industrial trends
📊 Key Data Releases & Events 📊
📅 Monday, August 4
Factory Orders (June) — Critical for industrial demand and trade momentum.
📅 Tuesday, August 5
ISM U.S. Services PMI (July) — Thermometer for expansion in the biggest part of the economy.
S&P U.S. Services PMI (July, flash) — Preliminary signal on service-sector strength.
Trade Balance (June) — Watching for impact of tariffs and shifting cross-border flows.
📅 Thursday, August 7
Initial & Continuing Jobless Claims — Weekly labor-market readings post weak payroll report.
Productivity & Labor Costs (Q2) — Reflect business efficiency and wage trend shifts.
Wholesale Inventories (June) — Key for supply-chain and inventory cycle insights.
Consumer Credit (June) — Measures household borrowing resilience.
📅 Friday, August 8
Fed Speech: St. Louis Fed President Musalem — Market-watchers will look for cues on the near-term rate path.
⚠️ Disclaimer:
This weekly outlook is for educational and informational purposes only and should not be construed as financial advice. Always consult a licensed financial advisor before making investment decisions.
📌 #trading #stockmarket #economy #tariffs #jobs #earnings #inflation #Fed #technicalanalysis
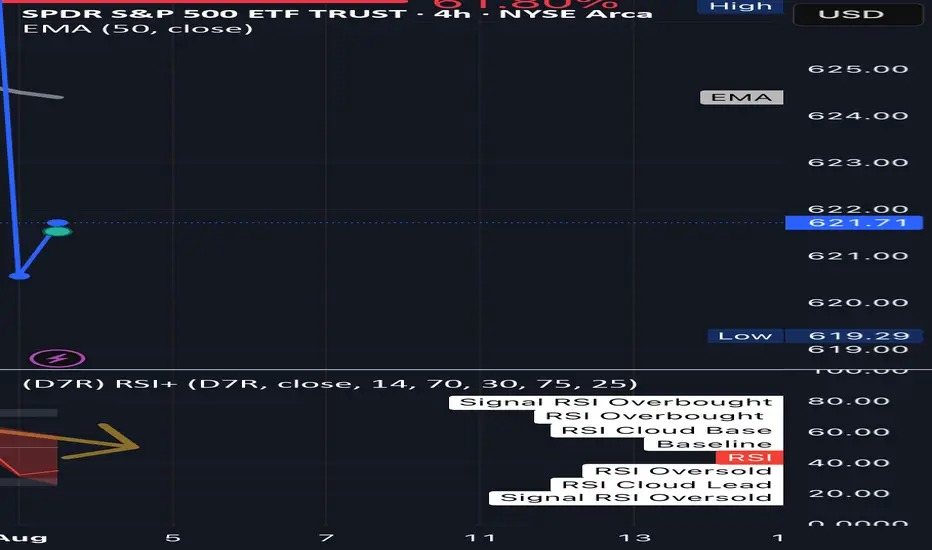
SPY 4H – Broke the Fib… Now What? Just Sharing What I See Hey People,
not an expert, just showing what i’m seeing on the 4H chart 👇
🧭 quick breakdown:
SPY ran up to around 639, then started dumping.
i dropped a fib from top to bottom and it hit the 61.8% level (626.66)… then lost it.
right now we’re sitting around 621, so it already broke a big level.
🧠 what that might mean:
if price gets back above 626, maybe we bounce back toward **629**
if not, and it keeps chilling under that **50 EMA (around 624)**, it’s probably still weak
nothing confirmed yet, i’m just watching how price moves around those spots.
⚠️ RSi is sketchy too:
rsi is making lower highs, even when price was up; that’s called bearish divergence
basically means momentum isn’t really behind the move
📉 If it keeps dropping:
if we lose 621, next support might be around **615**
and if that breaks? maybe even **610 gets swept** before any bounce
📝 Just how i’m seeing it rn:
not calling anything, just building my plan out loud
Still learning. open to feedback if you see something different
what levels are you watching?
I want everyone to win. 💛
SPY: Growth & Bullish Forecast
The price of SPY will most likely increase soon enough, due to the demand beginning to exceed supply which we can see by looking at the chart of the pair.
Disclosure: I am part of Trade Nation's Influencer program and receive a monthly fee for using their TradingView charts in my analysis.
❤️ Please, support our work with like & comment! ❤️

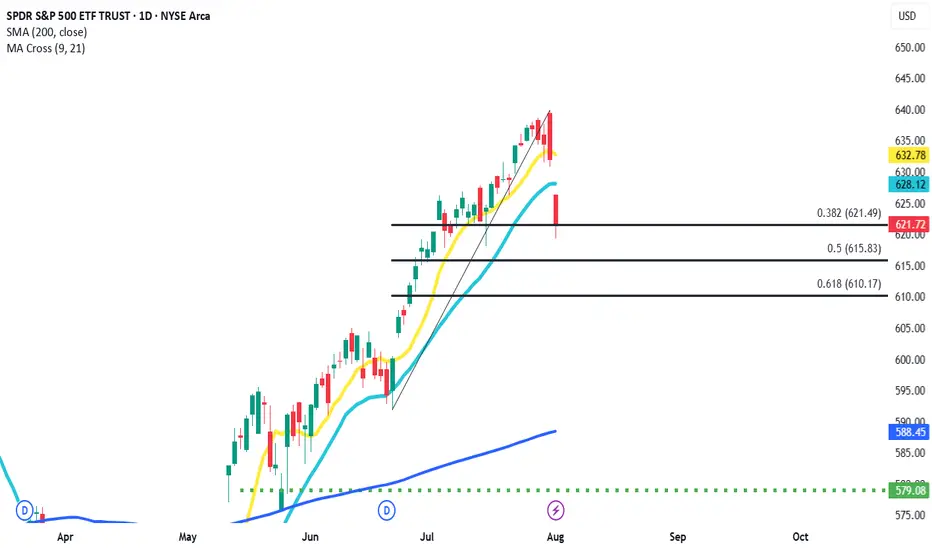
SPY bears finally show up. Here are my targetsLong term charts still look perfectly fine, and I'm not interested in fighting bears on the first day they show up in months. Here are the targets I'm looking at to find potential support

FIBO touch and goPretty violent last couple of days in July, but I honestly think it might be over for now. Price action couldn't break past .38 fibo retracement. If I'm right we could see continuation of uptrend in coming weeks.
Nightly $SPY / $SPX Scenarios for July 31, 2025🔮 Nightly AMEX:SPY / SP:SPX Scenarios for July 31, 2025 🔮
🌍 Market-Moving News 🌍
🏦 Fed Holds Rates — Dissent Indicates Division
The Federal Reserve maintained its benchmark rate at 4.25%–4.50%. Notably, two governors—Christopher Waller and Michelle Bowman—dissented in favor of a 25 bp rate cut, underscoring internal divisions amid growing political pressure
📈 Strong Q2 Growth, But No Rate-Cut Signal
U.S. GDP expanded at a 3.0% annualized rate in Q2, rebounding sharply from Q1's contraction. Despite this, Powell emphasized persistent inflation, particularly from tariffs, reinforcing the Fed’s cautious policy stance
🛢️ Oil Climbs as Tariff Tensions Rise
Brent crude rose to ~$73.51 and WTI to ~$70.37 on fears of supply disruptions tied to President Trump’s threats of new tariffs on Russian oil and new tariffs imposed on Brazil and South Korea
📊 Key Data Releases & Events 📊
📅 Thursday, July 31:
8:30 AM ET – Initial Jobless Claims (week ending July 26)
Initial claims rose to 222,000, up from 217,000 previously—an early gauge of labor-market trends
8:30 AM ET – Employment Cost Index (Q2)
Quarterly growth in labor costs edged lower to 0.8%, down from 0.9%—a signal of moderate wage pressures
8:30 AM ET – Personal Income (June)
Data released on household income and spending patterns—crucial for assessing consumer resilience heading into Q3
⚠️ Disclaimer:
This information is for educational and informational purposes only and should not be construed as financial advice. Always consult a licensed financial advisor before making investment decisions.
📌 #trading #stockmarket #economy #Fed #inflation #jobs #technicalanalysis
Market Outlook: Bulls are still in control, but be defensive.At theses levels don't let your guard down. I could see us pulling back next week, meanwhile we may continue to stay above the 10-EMA for now.

SPY: Aiming 626 today Slowly./ Let's observe what this market will give us. If there is a setup, we take the trade.

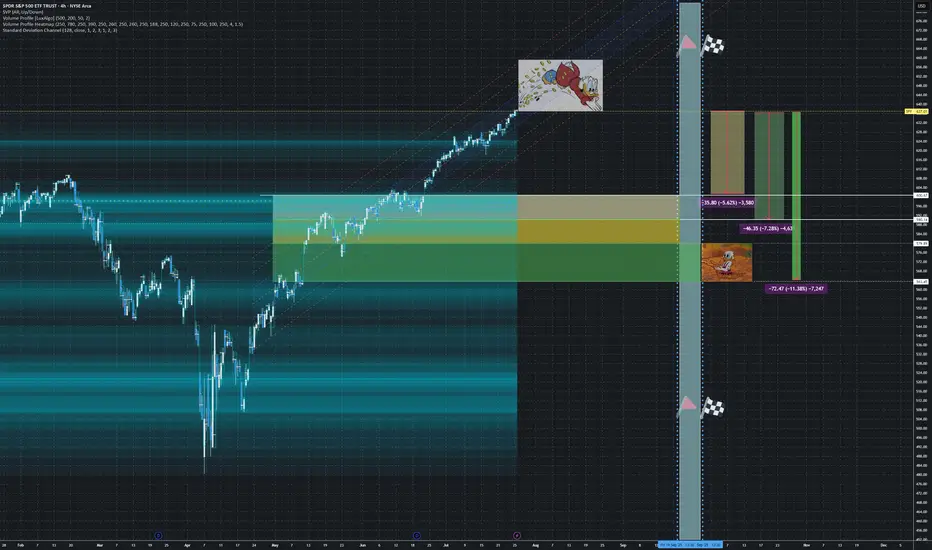
[$SPY] S&P500: The Big mini Short or Why hedging is not a crimeAMEX:SPY CBOE:XSP
No financial advice.
For Entertainment purpose only.
Have you ever considered to protect yourself and wake up from the 'Long-Only-Delirium'?
Now is the time.. do you hear the cracking in the bond-market?
Rate cutting will solve it?
No reason to panic?
Doomsday i*diot?
We will see... 😈 tic tac tic tac
This time THETA is against us, but GAMMA is bleeding.
📊 Strategy Characteristics
+++Note: We set this one as a 'Diagonal Ratio Put Spread'
> Diagonal: Because the options have different expiration dates (Sept 19 + Sept 30)
> Ratio: Because we are buying more puts than selling (4:2 ratio)
> Put Spread: Because both legs are puts with the same strike
"We are all at a wonderful ball where the champagne sparkles in every glass and soft laughter falls upon the summer air. We know, by the rules, that at some moment, the Black Horseman will come shattering through the great terrace doors, wreaking vengeance and scattering the survivors. Those who leave early are saved, but the ball is so splendid no one wants to leave while there is still time, so that everyone keeps asking, ‘What time is it? What time is it?’ But none of the clocks have any hands." ~George Goodman

[$SPY] S&P500: The Big mini Short or Why hedging is not a crimeAMEX:SPY
No financial advice.
For Entertainment purpose only.
Have you ever considered to protect yourself and wake up from the 'Long-Only-Delirium'?
Now is the time.. do you hear the cracking in the bond-market?
Rate cutting will solve it?
No reason to panic?
Doomsday i*diot?
We will see... 😈 tic tac tic tac
This time THETA is against us, but GAMMA is bleeding.
"We are all at a wonderful ball where the champagne sparkles in every glass and soft laughter falls upon the summer air. We know, by the rules, that at some moment, the Black Horseman will come shattering through the great terrace doors, wreaking vengeance and scattering the survivors. Those who leave early are saved, but the ball is so splendid no one wants to leave while there is still time, so that everyone keeps asking, ‘What time is it? What time is it?’ But none of the clocks have any hands." ~George Goodman
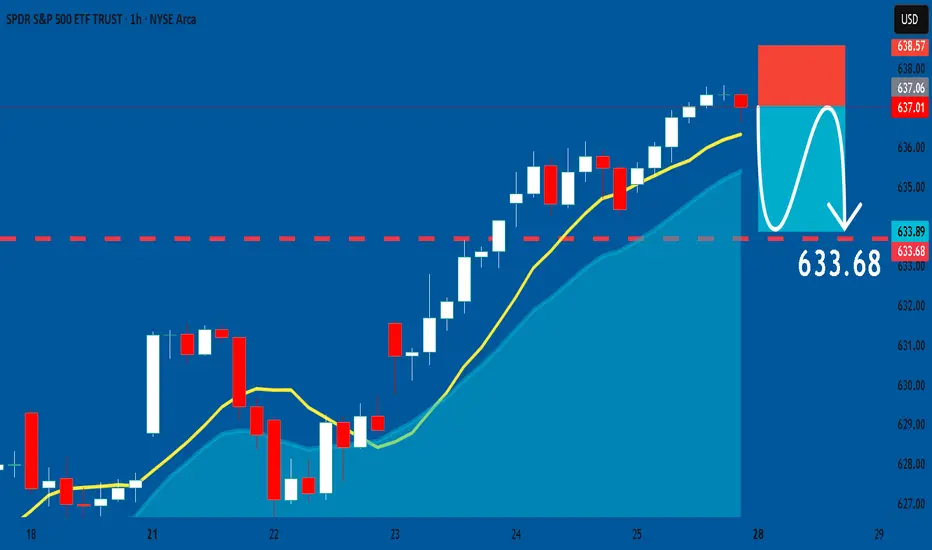
SPY: Bearish Continuation & Short Signal
SPY
- Classic bearish setup
- Our team expects bearish continuation
SUGGESTED TRADE:
Swing Trade
Short SPY
Entry Point - 637.01
Stop Loss - 638.57
Take Profit - 633.58
Our Risk - 1%
Start protection of your profits from lower levels
Disclosure: I am part of Trade Nation's Influencer program and receive a monthly fee for using their TradingView charts in my analysis.
❤️ Please, support our work with like & comment! ❤️
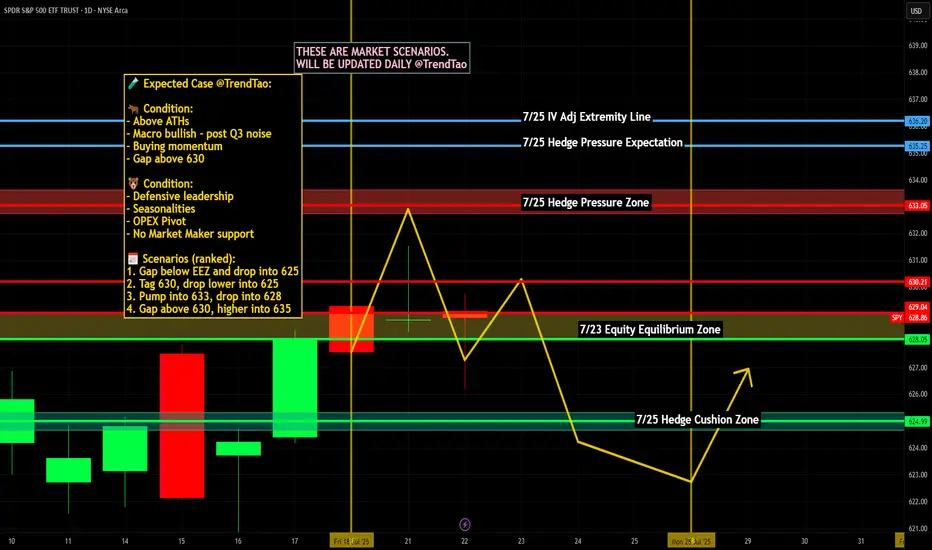
Nightly $SPY / $SPX Scenarios for July 24, 2025🔮 Nightly AMEX:SPY / SP:SPX Scenarios for July 24, 2025 🔮
🌍 Market-Moving News 🌍
🤝 U.S.–EU & U.S.–Japan Trade Optimism Lifts Sentiment
The S&P 500 and Nasdaq hit record-high closes on July 23, fueled by optimism over a potential U.S.–EU trade deal mirroring the U.S.–Japan framework, with the EU-set tariff on autos potentially halved to 15%
💵 Dollar Retreats, Yields Climb
As markets shifted toward risk assets, U.S. Treasury yields increased and gold softened, while the dollar eased—highlighting growing confidence in trade-driven growth news
🏦 Fed Independence Under Pressure—But No July Cut Expected
A Reuters poll shows economists see heightened political pressure on the Fed jeopardizing its independence, though the consensus remains that rates will stay unchanged this month
📊 Key Data Releases & Events 📊
📅 Thursday, July 24:
8:30 AM ET – Initial Jobless Claims
Weekly tally of new unemployment benefit applications—key indicator of labor-market conditions.
10:00 AM ET – New Residential Sales (June)
Tracks signed contracts for new homes, offering insight into housing demand under tightening mortgage rates.
All Day – Trade Headlines & Fed Watch
Continued focus on U.S.–EU trade developments and any follow-up to Fed independence concerns from policy circles.
⚠️ Disclaimer:
This information is for educational and informational purposes only—not financial advice. Please consult a licensed financial advisor before making investment decisions.
📌 #trading #stockmarket #trade #economy #Fed #housing #jobs #technicalanalysis
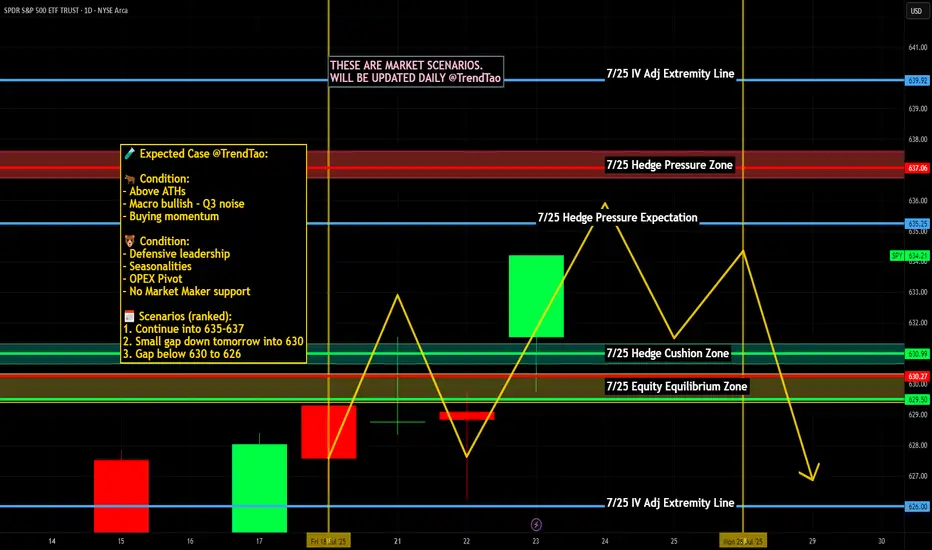
Nightly $SPY / $SPX Scenarios for July 23, 2025🔮 Nightly AMEX:SPY / SP:SPX Scenarios for July 23, 2025 🔮
🌍 Market-Moving News 🌍
📈 Morgan Stanley Stays Bullish
Morgan Stanley reaffirmed its optimistic view, forecasting the S&P 500 will reach 7,200 by mid‑2026. They cited strong earnings and anticipated rate cuts as key drivers, though warned of risks from rising Treasury yields and tariff-related cost pressure
📉 Inflation Debate Reignites
A renewed debate is underway regarding whether tariffs are "transitory" or persistent inflation drivers. Treasury counselor Joseph Lavorgna argued tariff impacts will be one-off, while others caution long-term price pressures may persist, complicating Fed policy directions
🏛️ Calls for Fed Reform Intensify
Treasury Secretary Scott Bessent suggested structural reforms to the Federal Reserve could have greater long-term impact than removing Chair Powell, highlighting ongoing concerns over central-bank governance amid political criticism
💳 Investors Shift to Corporate Bonds
As equity valuations have surged, investors are reallocating toward investment-grade corporate bonds, reducing credit spreads to the tightest levels since 1998—a sign of elevated risk appetite balanced with caution
📊 Key Data Releases & Events 📊
📅 Wednesday, July 23:
(No major U.S. economic releases)
Market focus remains on tech earnings (Tesla, Alphabet) and Fed signals following Tuesday’s Powell address.
⚠️ Disclaimer:
This information is for educational/informational purposes only and does not constitute financial advice. Please consult a licensed financial advisor before making investing decisions.
📌 #trading #stockmarket #economy #tariffs #Fed #earnings #corporatebonds
SPY "SP500 ETF" 1️⃣ Market Structure Overview
Change of Character (CHoCH) – Level: 626.19
The market printed a clear CHoCH at 626.19, breaking below a recent higher low. This shift signals the end of bullish dominance and marks the first warning of potential trend reversal. It’s a critical structure break indicating weakness in prior buy-side momentum.
Break of Structure (BOS) – Level: 631.54
A firm Break of Structure followed at 631.54, confirming the downtrend. This BOS came after price failed to establish a new high and instead reversed from the premium area, solidifying bearish continuation. It now acts as a key upper boundary for sellers.
2️⃣ Demand Zone Analysis (Support Levels)
The demand zones (green areas) are historical locations where price previously reacted strongly to the upside—suggesting institutional buying or significant liquidity absorption. These zones act as potential long-entry areas and support during pullbacks:
625.50: Immediate demand zone; price has hovered above this level recently, signaling short-term support.
624.80: Strong base formed after earlier accumulation; minor rally originated here.
623.80: Clear area of bullish imbalance; look for wick rejections here.
622.75 & 621.90: Deeper demand zones—likely to hold if the market retraces further and volatility spikes. These levels represent high-probability reversal points if liquidity sweep occurs below 624.
Each zone increases in risk/reward the deeper price pulls back, but also carries a higher chance of forming strong bullish reaction.
3️⃣ Supply Zone Analysis (Resistance Levels)
The supply zone (red area) at 628.85–631.54 was the origin of the last sharp bearish move following the BOS. It now acts as a potential reversal or distribution zone:
628.85 – 631.54:
This area previously held heavy sell-side interest and rejected bullish advances. It overlaps with a structural BOS and sits near the high of the prior rally. Watch for bearish price action or lower-timeframe exhaustion here. A break and close above 631.54 would invalidate this zone and indicate a major structural reclaim.
4️⃣ Current Price Action (Inside the Marked Border)
Price is currently reacting around 627, just above the CHoCH level (626.19). This zone lies between the upper boundary of the nearby demand and the lower edge of the supply. Within this boxed region:
Price is showing temporary consolidation, suggesting indecision.
A short-term dip into the 625.50–624.80 demand cluster is expected before any bullish leg.
If price holds above 626.19 and shows reversal signals (like bullish engulfing, hammer, or low-volume rejection), we may see continuation to test the 628.85–631.54 supply zone.
If structure fails and price breaks below 626.19 with conviction, the next downside targets are deeper into the 622–624 range.
This bordered zone represents a transitional area where the next directional move will likely be decided.
5️⃣ Momentum & Structure Bias
Structure remains bearish after the BOS, but current price is attempting to build a base.
If price maintains above CHoCH (626.19) and demand levels begin to hold, we may enter a bullish corrective phase.
Watch for rising volume on bullish candles or absorption wicks in demand zones as confirmation.
6️⃣ Macro/Fundamental Context (as of July 22, 2025)
While the chart is technical, the SPY ETF (S&P 500) is influenced by broader economic data. Around this date, watch for:
Earnings Season: Mid to late July often brings earnings from major S&P 500 companies. Positive tech earnings can fuel bullish momentum.
FOMC Speculation: If investors expect no rate hike or a dovish Federal Reserve stance, demand zones are more likely to hold.
Economic Reports: Look out for PMI or consumer confidence reports this week. A weak reading may drive SPY lower into demand, while a strong reading could help push it toward the supply zone.
If any bullish macro surprise occurs this week, it would support the bounce from the demand zone.

SPY Options Analysis Summary (2025-07-22)
🔻 AMEX:SPY Weak Bearish Put Setup (0DTE) – 07/22/25
All models agree: price is weak, momentum is limp, and VWAP is above.
But conviction? Not unanimous. High-risk, high-reward 0DTE scalpers only.
⸻
📉 Trade Setup
• 🟥 Direction: PUT
• 🎯 Strike: $626.00
• 💵 Entry: $0.57
• 💰 Target: $1.70 (+200%)
• 🛑 Stop: $0.28 (–50%)
• 📅 Expiry: Today (0DTE)
• ⚖️ Confidence: 65%
• ⏰ Entry Timing: Market Open
⸻
🧠 Multi-AI Consensus
Model Bias Action
Grok/xAI Weak Bearish ⚠️ No Trade
Claude Weak Bearish ⚠️ No Trade
Gemini Bearish ✅ $627 Put
Llama Moderately Bearish ⚠️ Conservative Put
DeepSeek Bearish ✅ $626 Put
🔹 VWAP < Price = Bearish bias
🔹 RSI = Neutral → watch for fakeouts
🔹 VIX favorable (<22)
🔹 Volume = weak = risk of whipsaw
⸻
⚠️ Risk Notes
• Bounce risk off session lows is real
• Lack of momentum may cause theta burn
• Best for scalpers who react fast — not a swing trade
• No conviction = smaller size, tighter leash
⸻
📢 Tagline (for virality):
“ AMEX:SPY is limping, not bleeding. But if it breaks, 200% comes fast. 0DTE scalpers: this is your window.” 💣

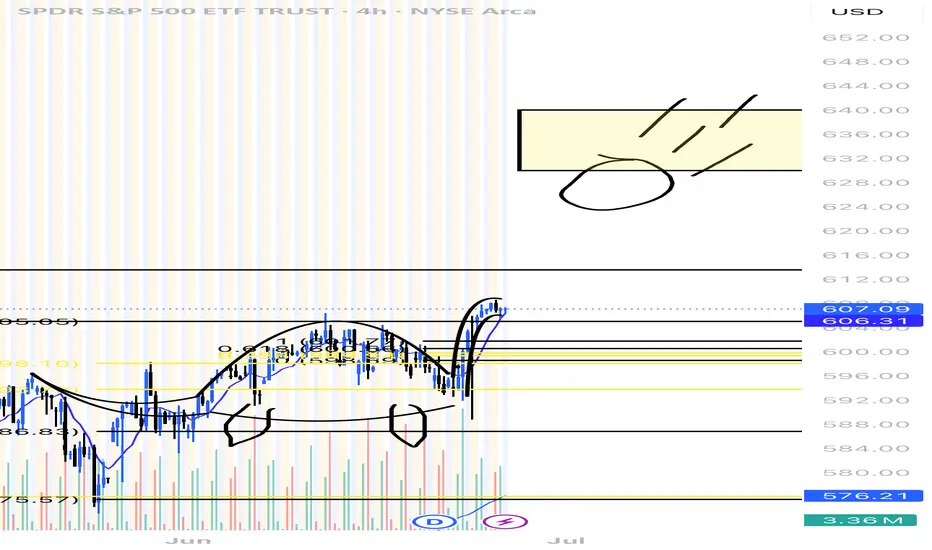
Dinosaur gets hit by a meteor We can see a clear breakout from previous lows only target left is that meteor at 630-640.
We will see this by the end of july!