SPY: Key Support Zones in FocusIf SPY drops to 490, that's nearly a 20% decline from its 611.39 peak. The 490–500 zone may stabilize recent volatility, but if it breaks, watch 470 — a key support and 20% below last year’s close.
SPY trade ideas

Don’t trade momentum rev strat is a reversal
2-1-2 bearish/bullish is a reversal
2-1-2 continuation is not a reversal it’s momentum

SPY is close to a bottom? More Downside ahead? (April 3, 2025)In this video, AMEX:SPY is showing early signs of being oversold on the weekly chart, but the pullback may not be over for another 150 days. So Let's talk about it and see what to expect next for SPY going forward!!

SPY: Breakdown with Strong Momentum – Key Targets Ahead
📉 Overview:
The S&P 500 ETF (SPY) has broken through a key support level with strong downward momentum. This bearish move suggests further downside potential, with key targets identified below.
🔍 Technical Analysis:
Price has decisively broken below a key support zone with strong momentum, indicating a potential continuation to the downside.
1st Target: Around $537.75, which aligns with the yearly mid-level support.
2nd Target: Around $510.27, which coincides with the 6-month low level.
Momentum indicators (Neon Momentum Waves) are trending downward, supporting bearish sentiment.
Long-Term Support: The yearly low at $466.43 remains a major downside level to watch if bearish pressure intensifies.
🚨 Trading Plan:
📌 Bearish Bias – Look for potential short entries on pullbacks towards the broken support level, now acting as resistance.
📌 Stop Loss: Consider placing stops above the breakdown level (~$560) to mitigate risk.
📌 Profit Targets:
First target: $537.75
Second target: $510.27
📊 Risk Management:
Keep an eye on volume and momentum indicators to confirm the bearish move.
If price reclaims the broken support level, reconsider the short thesis.
📢 Conclusion:
SPY is showing strong bearish momentum after breaking key support. If the trend continues, the price may reach the identified targets. Traders should monitor price action and momentum signals for confirmation.
⚠ Disclaimer: I'm not a financial expert—just sharing my thoughts based on my analysis. Always do your own research and manage risk accordingly.
Do you agree with this outlook? Let’s discuss in the comments! 🚀📉
#SPY #Trading #StockMarket #Bearish #TechnicalAnalysis #SwingTrade #Momentum #NotFinancialAdvice

$SPY: Second Bearish Wave in Motion, $537 First, $512 Next
AMEX:SPY , looking at the bear market that started in February, it looks today as if a 2nd bearish wave started. It will not be confirmed until $549 is broken, however Fib projections point to $537 as first stop, and eventually at $512 as 2nd stop.
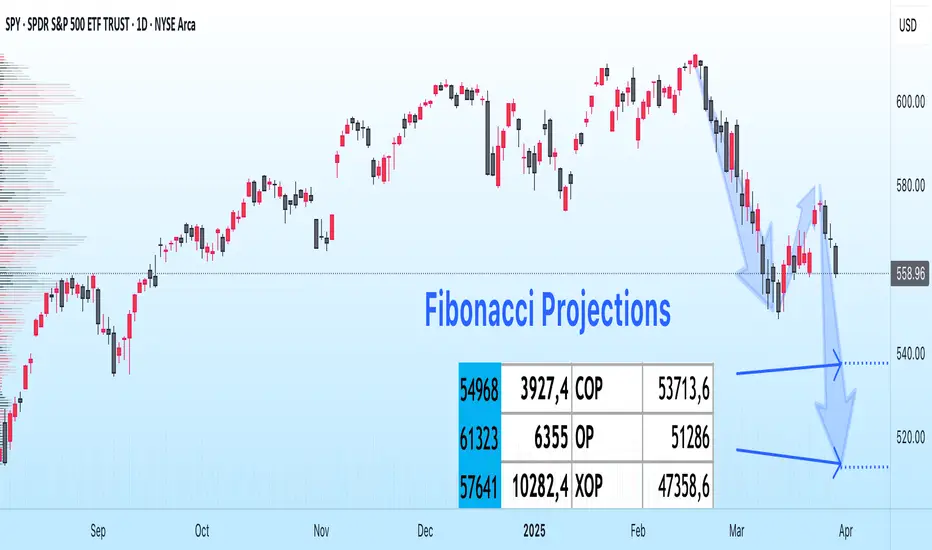
the FlushDown to 510 is possible on AMEX:SPY , there are some gaps there. We'll see. I wouldn't start buying until the VI shows either one more high or a double top.

$SPY #RisingWedge #BreakDOWN #ReTest #RecessionI highlighted the potential topping formation that could for especially if we see a rejection around 598-601 on XMas EVE via #XMasAlert.
This morning I am seeing signs of momentum wearing off PLUS what looks like a #BreakDOWN-ReTEST of a rising wedge look to the AMEX:SPY , check my TSLA to 420.69 Chart for conceptualization of this break out BELOW;
In my post 2 days ago () I mentioned Strikes TBD.
Well here are my favorites;
SPY 560P 3.21 (Bigger Risk Reward)
SPY 600P 3.21 (Essentially ATM Short w some Leverage)
-Prophecies
PS;
1) "I LOVE GOLD" - Fat BastarD
2) DONT OVER LOOK GOLD SAFETY HAVEN VIA CRYPTOCAP:BTC Headwinds?
3) And Don't Overlook NASDAQ:TSLA momentum... TO UPSIDE STILL (500Cs will be a play at somepoint this year #StayTuned)

Update for Mentorship on Trades and Key Levels $TSLA $SPY $NVDAUpdate for mentorship members on trades we've taken this week, Fib levels, support, divergence, potential tariff exemptions.

SPY/QQQ Plan Your Trade For 4-4 : Breakaway PatternToday is a very interesting day because my MRM investment model turned BEARISH on the Daily chart. That means we have broken through major support because of this tariff war and the markets are not OFFICIALLY (based on my models) into a Daily BEARISH trend (or a Daily Broad Pullback Phase).
What that means is we need to start thinking of the markets as OVERALL BEARISH and trying to identify support - or a base/bottom in the near future.
This is no longer a BULLISH market - everything seems to have flipped into a BEARISH primary trend (OFFICIALLY).
So, watch this video to understand how Fibonacci price levels will likely play out as the SPY targeting the 500-505 level (possibly lower) and where the same Fibonacci price levels will prompt the QQQ to target 395-400.
BUCKLE UP. This is a BIG CHANGE related to overall market trend.
Gold is holding up much better than Silver. But I still believe this is a PANIC selling phase in Gold/Silver and they will both base/recovery and RALLY much higher.
The funny thing about the cycles in Gold/Silver is this:
In 2007-08, just after the major expansion phase completed, the Global Financial Crisis hit - prompting a large downward price rotation in metals.
Maybe, just maybe, this forced tariff war issue is a disruption that will "speed up" the process of metals rallying above $5000++ over the next 60+ days.
I see this move as PHASES and it appears the tariff disruption may prompt a faster Phase-Shift for metals over the next few months. We'll see.
BTCUSD seems to be in SHOCK. It's really going nowhere on very low volume.
If BTCUSD is a true hedge or alternate store of value - I would think it would have an upward reaction to this selling.
We'll see how this plays out.
Get some.
#trading #research #investing #tradingalgos #tradingsignals #cycles #fibonacci #elliotwave #modelingsystems #stocks #bitcoin #btcusd #cryptos #spy #gold #nq #investing #trading #spytrading #spymarket #tradingmarket #stockmarket #silver

$540 incoming put trade expiring 4/4 or 4/11
AMEX:SPY
I start these Anchored VWAPs where the volume was the lowest before a major upside or downside.
When I entered this trade $540 expiring 4/4 was at $.5 on 3/27 on Thursday around 9.55am currently $2.06 closing week, however I want to highlight that the $540-$530 would be the major leg down and we might see the $570-$580 levels for first week of June imo.
Note: I am heavily comparing price actions for nowadays with 2022 first half drawdown.

Magnificent Value Index with Opacity CandlesThis script idea is rather old but very enlightening about the current state of the market.
It looks at the RSI or MFI values of all Mag 7 stocks, averages them out and compares it to qqq's rsi or mfi as a differential.
Real shame tradingview doesn't allow free users to participate in publishing indicators and it's a real shame the war their employees support is being lost.
Make whatever conclusions you will from this.
Good luck, we're all living in a global idiocratic world now ruled by people infected with Affluenza .

Nightly $SPY / $SPX Scenarios for April 4, 2025🔮 🔮
🌍 Market-Moving News 🌍:
🇺🇸📊 March Employment Report Release: The Bureau of Labor Statistics will release the March employment report, with forecasts predicting an addition of 140,000 nonfarm payrolls and an unemployment rate holding steady at 4.1%. This data will provide insights into the labor market's health and potential implications for Federal Reserve policy.
🇺🇸💬 Federal Reserve Chairman Powell's Address: Federal Reserve Chairman Jerome Powell is scheduled to speak at 11:25 AM ET. Investors will be closely monitoring his remarks for any indications regarding future monetary policy, especially in light of recent market volatility.
🇺🇸📈 Market Reaction to 'Liberation Day' Tariffs: Following President Donald Trump's announcement of new tariffs, dubbed "Liberation Day" tariffs, the markets experienced significant declines. The S&P 500 dropped 4.8%, and the Nasdaq Composite fell 6%, marking the worst trading day since 2020. Investors are bracing for continued volatility as the market digests the potential economic impacts of these tariffs.
📊 Key Data Releases 📊
📅 Friday, April 4:
👷♂️ Nonfarm Payrolls (8:30 AM ET):
Forecast: +140,000
Previous: +151,000
Indicates the number of jobs added or lost in the economy, excluding the farming sector.
📈 Unemployment Rate (8:30 AM ET):
Forecast: 4.1%
Previous: 4.1%
Represents the percentage of the total workforce that is unemployed and actively seeking employment.
💵 Average Hourly Earnings (8:30 AM ET):
Forecast: +0.3%
Previous: +0.3%
Measures the month-over-month change in wages, providing insight into consumer income trends.
⚠️ Disclaimer: This information is for educational and informational purposes only and should not be construed as financial advice. Always consult a licensed financial advisor before making investment decisions.
📌 #trading #stockmarket #economy #news #trendtao #charting #technicalanalysis

SPY going up to 593 by middle of AprilThe market is going to be bullish after the bearish move we just witnessed recently. Typically, I switch to the weekly format to see a larger move. You can see on the weekly chart, the Stoch RSI is turning bullish. I recently made a 3-day format which shows the indicators are already showing a bullish trend. I will post the 3 day chart/indicators as well as the weekly chart after this chart in my notes.
TARGETS:
53 point move: 599
1.618 move: 593.77
11 bar moves: April 17
**If it hits one of these targets, I am out of my trade.
** I will keep a close watch when the SPY hits 1 fib retracement at 575
** I changed my wording from 'day' to 'bar' moves
STOPS:
1) the low of the previous Heikin Ashi candlestick,
2) 2 red Heikin Ashi candlesticks,
3) a specific dollar amount for a total loss for my trade or
4) a specific dollar amount per contract.
**If it hits one of those stops, I am out of my trade.
I am using the Heikin Ashi candlesticks.
1) They show more of a directional movement within candlesticks.
2) They tend to filter out the market noise so you can see the market direction better.
3) It reduces false signals, allowing you to stay in the trade longer.
4) And, it gives you a smoother appearance making it easier to see trends and reversals. (This information is from Dr. Keith Wade who speaks at the Wealth365 Summits.)
Typically, I would wait until there are 2 green daily Heikin Ashi green candlesticks before entering.
I still tend to switch back and forth between Heikin Ashi candlesticks and regular candlesticks since regular candlesticks are what I am familiar with and have been using since I started trading.
I personally find:
* the 5 minute indicators typically represents what will happen in the next half and hour.
* the 10 minute indicators typically represents what will happen in the next hour.
* the 30 minute indicators typically represents what will happen in the daily.
* and, the hour indicators typically represents what will happen in the next week.
But right now, I am fine tuning my indicators and looking at the 20 to 25 minute indicators to precipitate a daily move
I use the MacD, the Stock RSI and the DMI to assist me with the direction of the market. Hopefully, I can explain these indicators more in the future.
Ask me any questions or point out anything you see wrong, as this is the only way we learn.
Happy Trading!


A few scenarios for the SPY! 🔉Sound on!🔉
📣Make sure to watch fullscreen!📣
Thank you as always for watching my videos. I hope that you learned something very educational! Please feel free to like, share, and comment on this post. Remember only risk what you are willing to lose. Trading is very risky but it can change your life!

Will start longs at 516I think SPY is going down to 516 (0.382 Fibonacci retracement) and could go down to 485 (0.500 Fibonacci retracement). I will start taking long positions again at 516. Back in 2022 there was a 0.500 Fibonacci retracement where SPY went from 479 to 348 but I know people have short memories.

Spy Road To $544 Target HIT Now WhatWell we finally hit our target a lot of us went heavy in shorts right before the bell rang in many Etf's SPY QQQ Tsla with massive amounts of money With Expirations Expiring 4/3 4/5 and also 2weeks out.... Don't Ever Miss Another Move in the stock market again stay up to date With JoeWtrades.... So I guess everyone wants to know what's next Bear Market Bull Market is the the bottom in ext.... Nope this is not the bottom, i already have a plan on what's going to happen price will continue to fall Friday Over the Weekend Resulting in a possible Dead Cat Bounce come Tuesday in my opinion back to $550ish, Wait what did you say yes $dead cat bounce to $550ish in the next few days possibly Tuesday so this means this is not the bottom JoeWtrades , Nope in my opinion its not Like and follow to see in my opinion on where price goes, if you need assistance and would like to take your trading and scalping to the next level You know what to do.... As Always safe trades and good luck

SPY - Support st 40 Mo. AgvIn doing long term analysis last year, I noticed that major waves 2 and 4 generally terminate at the 40 month moving average. So it appears that 472 is the current target. Keep in mind however that wave 5 will eventually take us to new highs. Then, - LOOK OUT BELOW

$SPY Big Support at 540 and 50% fib levelAMEX:SPY Big Support at 540 and 50% fib level, I thinks it's unlikely to break the $540 mark.

Trump's Tariff Wars : What To Expect And How To Trade Them.I promised all of you I would create a Trump's Tariff Wars video and try to relate that is happening through the global economy into a rational explanation of HOW and WHY you need to be keenly away of the opportunities presented by the new Trump administration.
Like Trump or not. I don't care.
He is going to try to enact policies and efforts to move in a direction to support the US consumer, worker, business, and economy.
He made that very clear while campaigning and while running for office (again).
This video looks at the "free and fair" global tariffs imposed on US manufacturers and exports by global nations over the past 3+ decades.
For more than 30+ years, global nations have imposed extreme tariffs on US goods/exports in order to try to protect and grow their economies. The purpose of these tariffs on US good was to protect THEIR workers/population, to protect THEIR business/economy, to protect THEIR manufacturing/products.
Yes, the tariffs they imposed on US goods was directly responsible for THEIR economic growth over the past 30-50+ years and helped them build new manufacturing, distribution, consumer engagement, banking, wealth, and more.
The entire purpose of their tariffs on US goods was to create an unfair advantage for their population to BUILD, MANUFACTURE, and BUY locally made products - avoiding US products as much as possible.
As I suggested, that is why Apple, and many other US manufacturers moved to Asia and overseas. They could not compete in the US with China charging 67% tariffs on US goods. So they had to move to China to manufacture products because importing Chinese-made products into the US was cheaper than importing US-made products into China.
Get it?
The current foreign Tariffs create an incredibly unfair global marketplace/economy - and that has to STOP (or at least be re-negotiated so it is more fair for everyone).
And I believe THAT is why Trump is raising tariffs on foreign nations.
Ultimately, this will likely be resolved as I suggest in this video (unless many foreign nations continue to raise tariff levels trying to combat US tariffs).
If other foreign nation simply say, "I won't stand for this, I'm raising my tariff levels to combat the new US tariffs", then we end up where we started - a grossly unfair global marketplace.
This is the 21st century, not the 18th century.
Step up to the table and realize we are not in the 1850s or 1950s any longer.
We are in 2025. Many global economies are competing at levels nearly equal to the US economy in terms of population, GDP, manufacturing, and more.
It's time to create a FREE and FAIR global economy, not some tariff-driven false economy on the backs of the US consumers. That has to end.
Get some.
#trading #research #investing #tradingalgos #tradingsignals #cycles #fibonacci #elliotwave #modelingsystems #stocks #bitcoin #btcusd #cryptos #spy #gold #nq #investing #trading #spytrading #spymarket #tradingmarket #stockmarket #silver

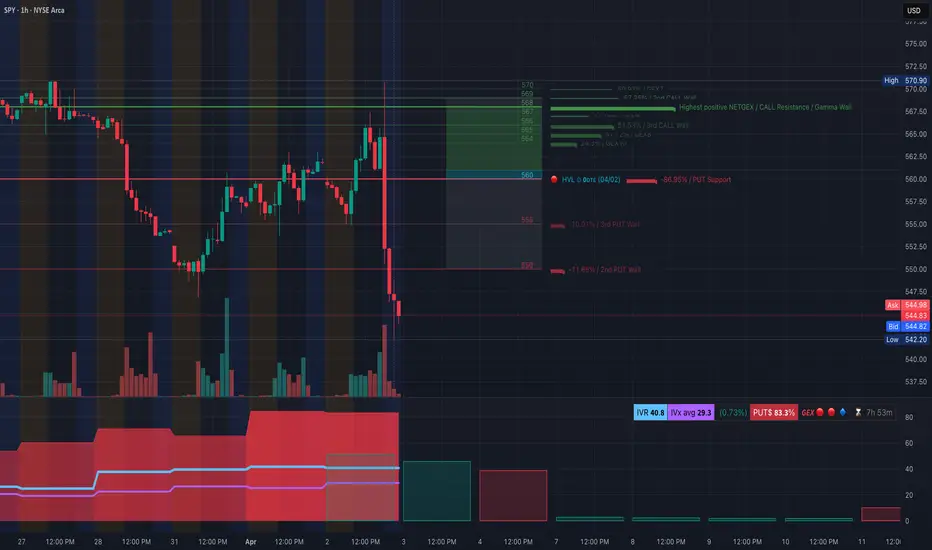
SPY Slammed After Tariff Shock! Dealer Gamma TrapSPY Slammed After Tariff Shock! Dealer Gamma Trap Accelerates Drop 🔻
🌎 Context: April 2, 2025
Today’s Trump tariff news set off a panic wave in the market — triggering a sharp sell-off in major indices. SPY, the S&P 500 ETF, lost grip on its HVL ($560) and flushed into a dealer short-gamma zone, where volatility surged as hedging flows flipped bearish.
Key Narrative:
* Macro shock = Tariff fears
* Market wasn’t positioned = IV spike + dealer scrambling
* Result = Gamma-driven slide with no call support nearby
🧭 Technical Breakdown – 1H Chart
🔻 Price Action:
* SPY broke down from $567-$565 support range.
* Panic candle sliced through HVL $560 and continued through $550, tagging $542.20 intraday low.
* The entire move below HVL now triggers short-gamma conditions.
📌 Support Zones:
* $544.82 (currently testing)
* $542.20 (session low)
* Below that? Thin air until $538–$535 zone from macro FVGs.
🔼 Resistance Zones:
* $550 = now resistance (2nd PUT Wall)
* $555 = 3rd PUT Wall (likely a pause/reload area)
* $560 = HVL / Former gamma support flipped resistance
🧠 GEX + Options Sentiment
💣 Gamma Exposure (GEX):
* 🚨 GEX flipped heavily negative under $560.
* HVL $560 has collapsed.
* Dealers are now short gamma, adding to volatility and forced selling pressure.
🔴 Gamma Risk Zones:
* PUT Support at $560 (-86.95% GEX)
* Walls stacked at $555 and $550 → now broken
* NO significant GEX support until $540 — more room to fall
📈 Options Oscillator:
* IVR 40.8 / IVx Avg 29.3 → Elevated volatility with room to run
* PUTS 83.3% dominance = bearish sentiment confirmed
* Red Red Blue GEX = maximum dealer pain, negative gamma loop
🧭 Trade Setups Based on Current Conditions
🐻 Bearish Breakdown (Primary Bias)
* Entry: Under $543 (below today's low)
* Target: $540 → $535
* Stop: Over $550 reclaim
* Contract: 0DTE/2DTE $545P or $540P for gamma scalping
* Note: Dealer hedging is directional, be precise and fast
🐂 Relief Bounce Setup (Low Conviction)
* Only valid if SPY reclaims $550 and shows slowing momentum
* Possible dead-cat bounce to $555–$560
* Prefer spreads due to high IV and fast time decay
📌 Key Levels Summary
HVL (Former Support) $560 Gamma flip zone — now resistance
Gamma Pivot $550 Broke down — keep an eye on it
Support Zone $542.20 Session low
Downside Target $540 → $535 If gamma slide continues
💭 My Thoughts: This Is a Gamma Meltdown
Today’s tariff headlines sparked a reflexive gamma cycle — as dealers flipped from long to short gamma, they were forced to hedge dynamically, driving SPY deeper into a liquidity vacuum.
This is not your regular dip — it’s a liquidity and dealer flow event, so everything moves faster, with wild swings possible into the close or tomorrow.
Unless SPY reclaims HVL at $560 fast, expect continuation or chop within this danger zone. VIX rising + GEX red = recipe for pain.
📢 Final Notes:
* Use defined risk.
* Don’t overstay puts.
* Gamma moves cut both ways — expect volatility.
* Track GEX hourly if possible.
Disclaimer: For educational purposes only. This is not financial advice. Always do your own research and protect your capital.
SPY/QQQ Plan Your Trade For 4-3 : GAP Breakaway PatternFirst off, thank you for all the great comments and accolades related to my calling this breakdown (nearly 60+ days ago).
Did I get lucky having these new tariffs announced, causing the markets to break downward? Probably.
Did my research suggest the markets were going to break downward anyway? YES.
Did my research predict these tariffs? NO.
My research is specifically price-based. You'll notice I don't use many indicators, other than my proprietary price pressure and momentum indicators.
The purpose of what I'm trying to teach all of you is that price is the ultimate indicator. You can use other indicators if you find them helpful. But, you should focus on the price chart and try to learn as much as you can from the price chart (without any indicators).
Why, because I believe price tells us everything we need to know and we can react to price more efficiently than getting confused by various technical indicators.
At least, that is what I've found to be true.
Today's pattern suggests more selling is likely. After the markets open, I suggest there will be a bunch of longs that will quickly be exited and shorts that will be exited (pulling profits). Thus, I believe the first 30-60 minutes of trading could be extremely volatile.
My extended research suggests the markets will continue to try to move downward (over the next 60+ days) attempting to find the Ultimate Low. But, at this point, profits are profits and we all need to BOOK THEM if we have them.
We can always reposition for the next breakdown trade when the timing is right.
Gold and Silver are moving into a PANIC selling phase. This should be expected after the big tariff news. Metals will recover over the next 3-5+ days. Get ready.
BTCUSD is really not moving on this news. Kinda odd. Where is BTCUSD as a hedge or alternate store of value? I don't see it happening in price.
What I do see is that BTCUSD is somewhat isolated from this tariff news and somewhat isolated from the global economy. It's almost as if BTCUSD exists on another planet - away from global economic factors.
Still, I believe BTCUSD will continue to consolidate, attempting to break downward over the next 30+ days.
Remember, trading is about BOOKING PROFITS and moving onto the next trade. That is what we all need to focus on today.
Get Some.
#trading #research #investing #tradingalgos #tradingsignals #cycles #fibonacci #elliotwave #modelingsystems #stocks #bitcoin #btcusd #cryptos #spy #gold #nq #investing #trading #spytrading #spymarket #tradingmarket #stockmarket #silver

SPY Update + Learn & Understand the concept below!!Red vs. Teal has been the storyline for this downward momentum and it continues to be as we saw a strong hold from (bullish) red earlier in the week and after rejecting off of teal yesterday, this subsequent gap down that we're currently seeing.
If we've built enough bearish liquidity utilizing our green controlled buying, we can see this dump penetrate this 547 support level and continue deeper with a mid-term target in the low $500's.
However, if sufficient liquidity hasn't been built, per the laws of S&D, we will need to continue higher for a bit to grab more sellers and soak up more buyers prior to that penetration.
Whenever the move seems too obvious in the market, expect it to look that way purposely and for it to be a trap. Get you to sell when it's so obviously bearish - and then the market pushes up as you realize that everyone who sold is the reason why it's going to now push up - big money will force you and the others to buy back your sells at a higher price/loss and that's where big money then swoops in, when things maybe started to look a bit bullish, and pushes the market down by selling back to you all your stop loss buys in one fell swoop!
Learn this concept, understand it, and your trading will change forever. That knowledge combined with an understanding of how the algorithms inform the market's liquidity, is why I draw so many lines on my chart.
Happy Trading :)
